

Question: show work if possible Current Attempt in Progress Using the information provided in the table, the network diagram and the project completion time - 25
show work if possible 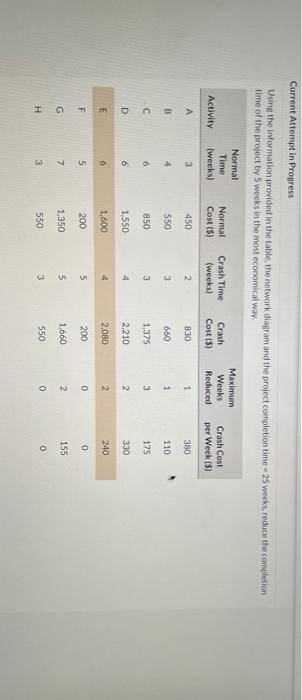
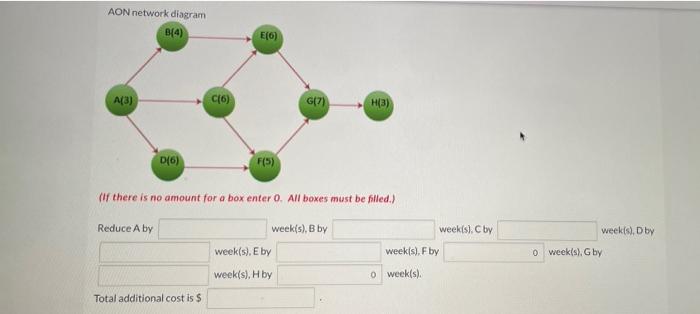
Current Attempt in Progress Using the information provided in the table, the network diagram and the project completion time - 25 weeks, recuce the comotion time of the project by 5 weeks in the most economical www. Normal Time (weeks) Normal Cost (5) Activity Crash Time (weeks) Maximum Weeks Reduced Crash Cost (5) Crash Cost per Week (5) 380 A A 3 450 2 830 1 B 4 550 3 660 1 110 6 850 3 1.375 3 175 D 6 1.550 4 2.210 2 330 E 6 1.600 4 2,080 2 240 F 5 200 5 200 0 0 7 G 1.350 5 2 1.660 155 H 3 o H 550 550 3 0 AON network diagram B(4) E(6) A(3) C6) G(7) H(3) D(6) F(5) (if there is no amount for a box enter 0. All boxes must be filled.) Reduce A by week(s), B by week(s). C by weeks), Dby o week(s), G by week(s). E by weeks). F by week(s), H by o week(s): Total additional cost is $ Step by Step Solution
There are 3 Steps involved in it
1 Expert Approved Answer
Step: 1 Unlock

Question Has Been Solved by an Expert!
Get step-by-step solutions from verified subject matter experts
Step: 2 Unlock
Step: 3 Unlock