

Question: show work please 1. -8 Points - Softballs at Titan Company (12-inch) must meet stringent quality control standards. To meet those standards, Titan Company needs
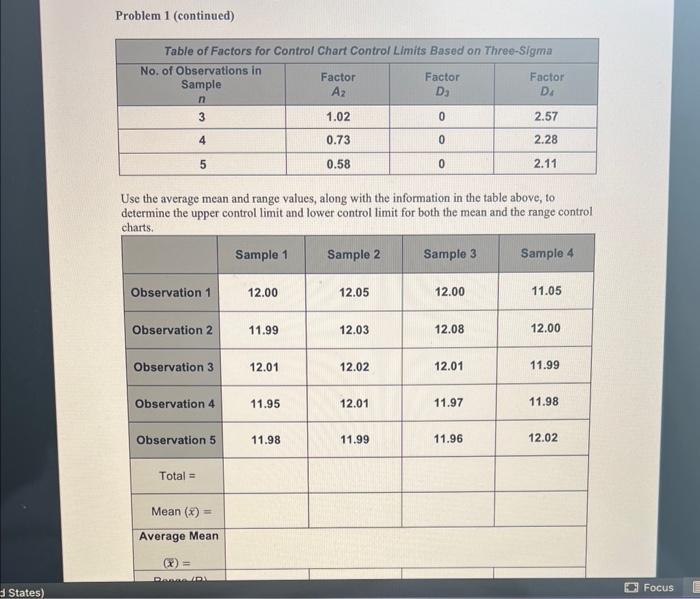
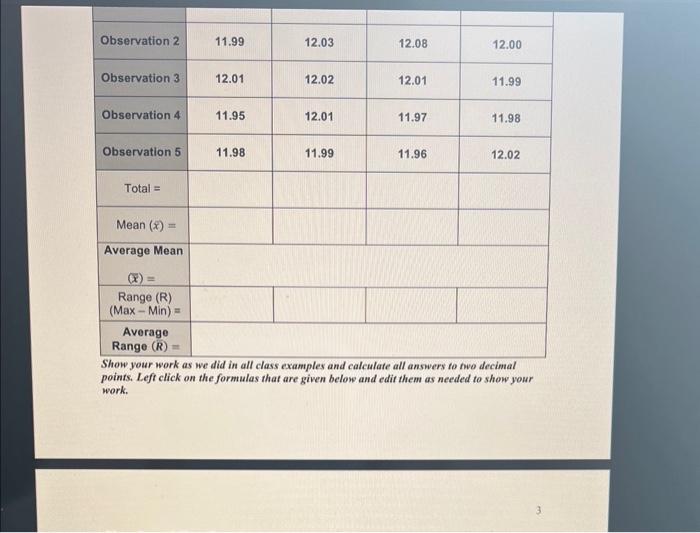
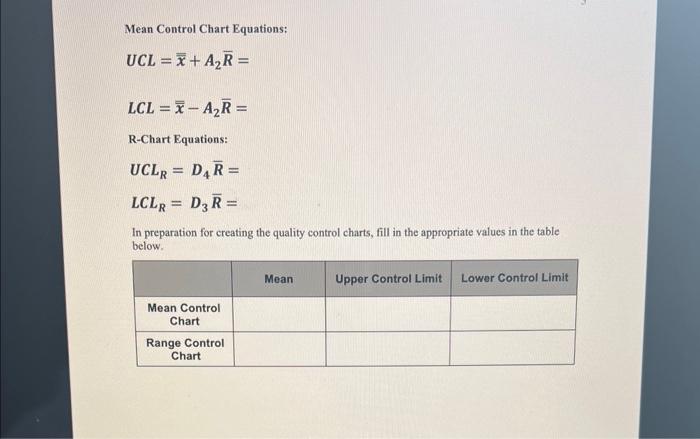
1. -8 Points - Softballs at Titan Company (12-inch) must meet stringent quality control standards. To meet those standards, Titan Company needs to create three-sigma mean and range control charts for its inspection process. For those charts, the company has collected the following samples of its process output. Calculate the Total for each sample, the Mean of each sample, and the Range of each sample to two decimals. Calculate the Average Mean and the Average Range to two decimals. Remember: n= number of observations per sample! Problem 1 continues on the next page. Problem 1 (continued) Use the average mean and range values, along with the information in the table above, to determine the upper control limit and lower control limit for both the mean and the range control points. Left click on the formulas that are given below and edit them as needed to show your work. Mean Control Chart Equations: UCL=x+A2R= LCL=xA2R= R-Chart Equations: UCLR=D4R=LCLR=D3R= In preparation for creating the quality control charts, fill in the appropriate values in the table below
Step by Step Solution
There are 3 Steps involved in it

Get step-by-step solutions from verified subject matter experts