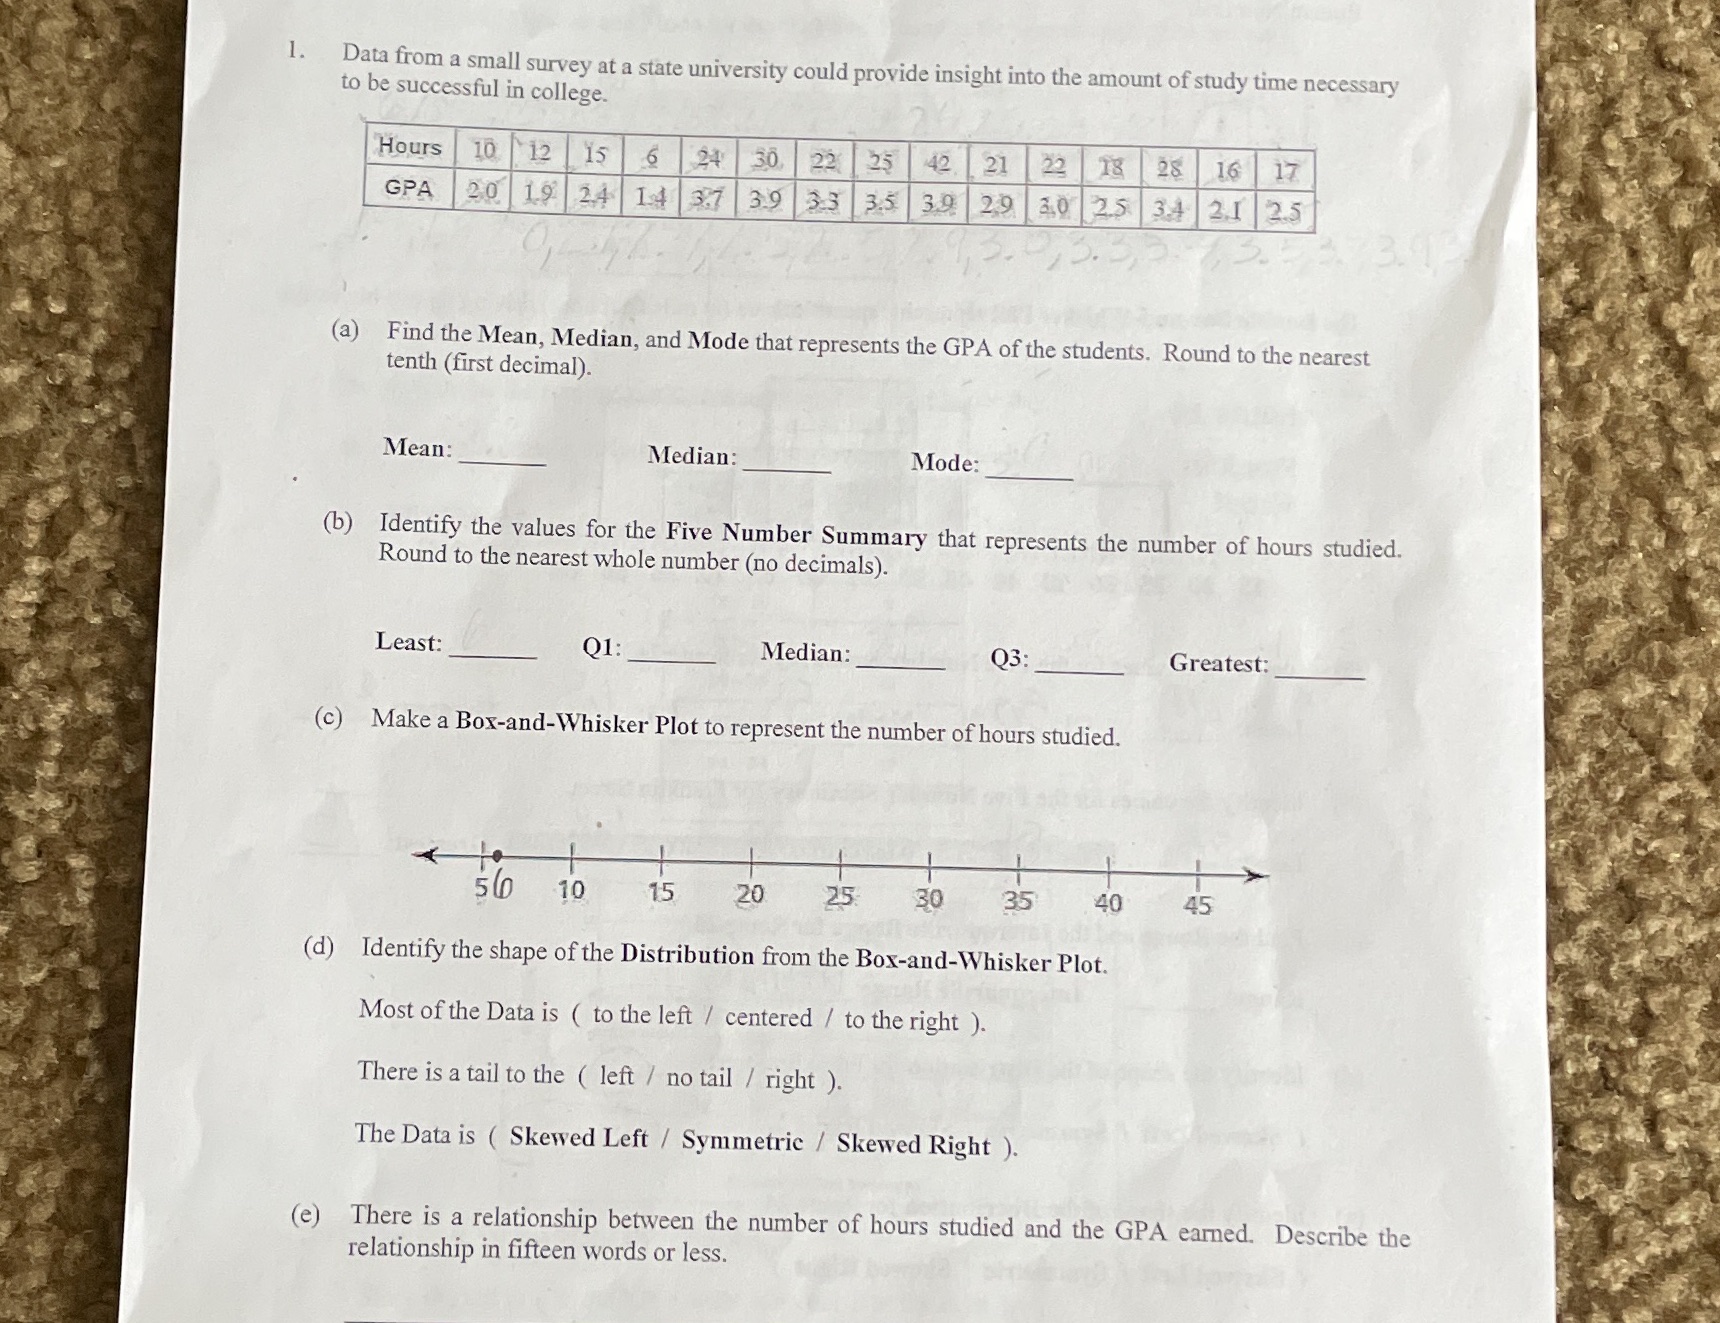
Question: Show work please 1 . Data from a small survey at a state university could provide insight into the amount of study time necessary to

Show work please

Show work please 1 . Data from a small survey at
1 . Data from a small survey at a state university could provide insight into the amount of study time necessary to be successful in college. Hours 10 12 15 6 24 30 22 25 42 21 22 28 16 17 GPA 20 19 24 14 3.9 3:3 3.5 3.9 29 20 25 3.4 2.1 2.5 3.92 (a) Find the Mean, Median, and Mode that represents the GPA of the students. Round to the nearest tenth (first decimal). Mean: Median: Mode: (b) Identify the values for the Five Number Summary that represents the number of hours studied. Round to the nearest whole number (no decimals) Least: Q1: Median: 03: Greatest: (c) Make a Box-and-Whisker Plot to represent the number of hours studied. 560 10 25: 30 40 45 (d) Identify the shape of the Distribution from the Box-and-Whisker Plot. Most of the Data is ( to the left / centered / to the right ). There is a tail to the ( left / no tail / right ). The Data is ( Skewed Left / Symmetric / Skewed Right ). (e) There is a relationship between the number of hours studied and the GPA earned. Describe the relationship in fifteen words or less

Step by Step Solution

There are 3 Steps involved in it

1 Expert Approved Answer
Step: 1 Unlock blur-text-image
Question Has Been Solved by an Expert!

Get step-by-step solutions from verified subject matter experts

Step: 2 Unlock
Step: 3 Unlock

Students Have Also Explored These Related Mathematics Questions!