

Question: Show work please 9. (1 point) The following graph shows the approximate number (in thousands) of people who emigrated from Ireland during the period 2010

Show work please
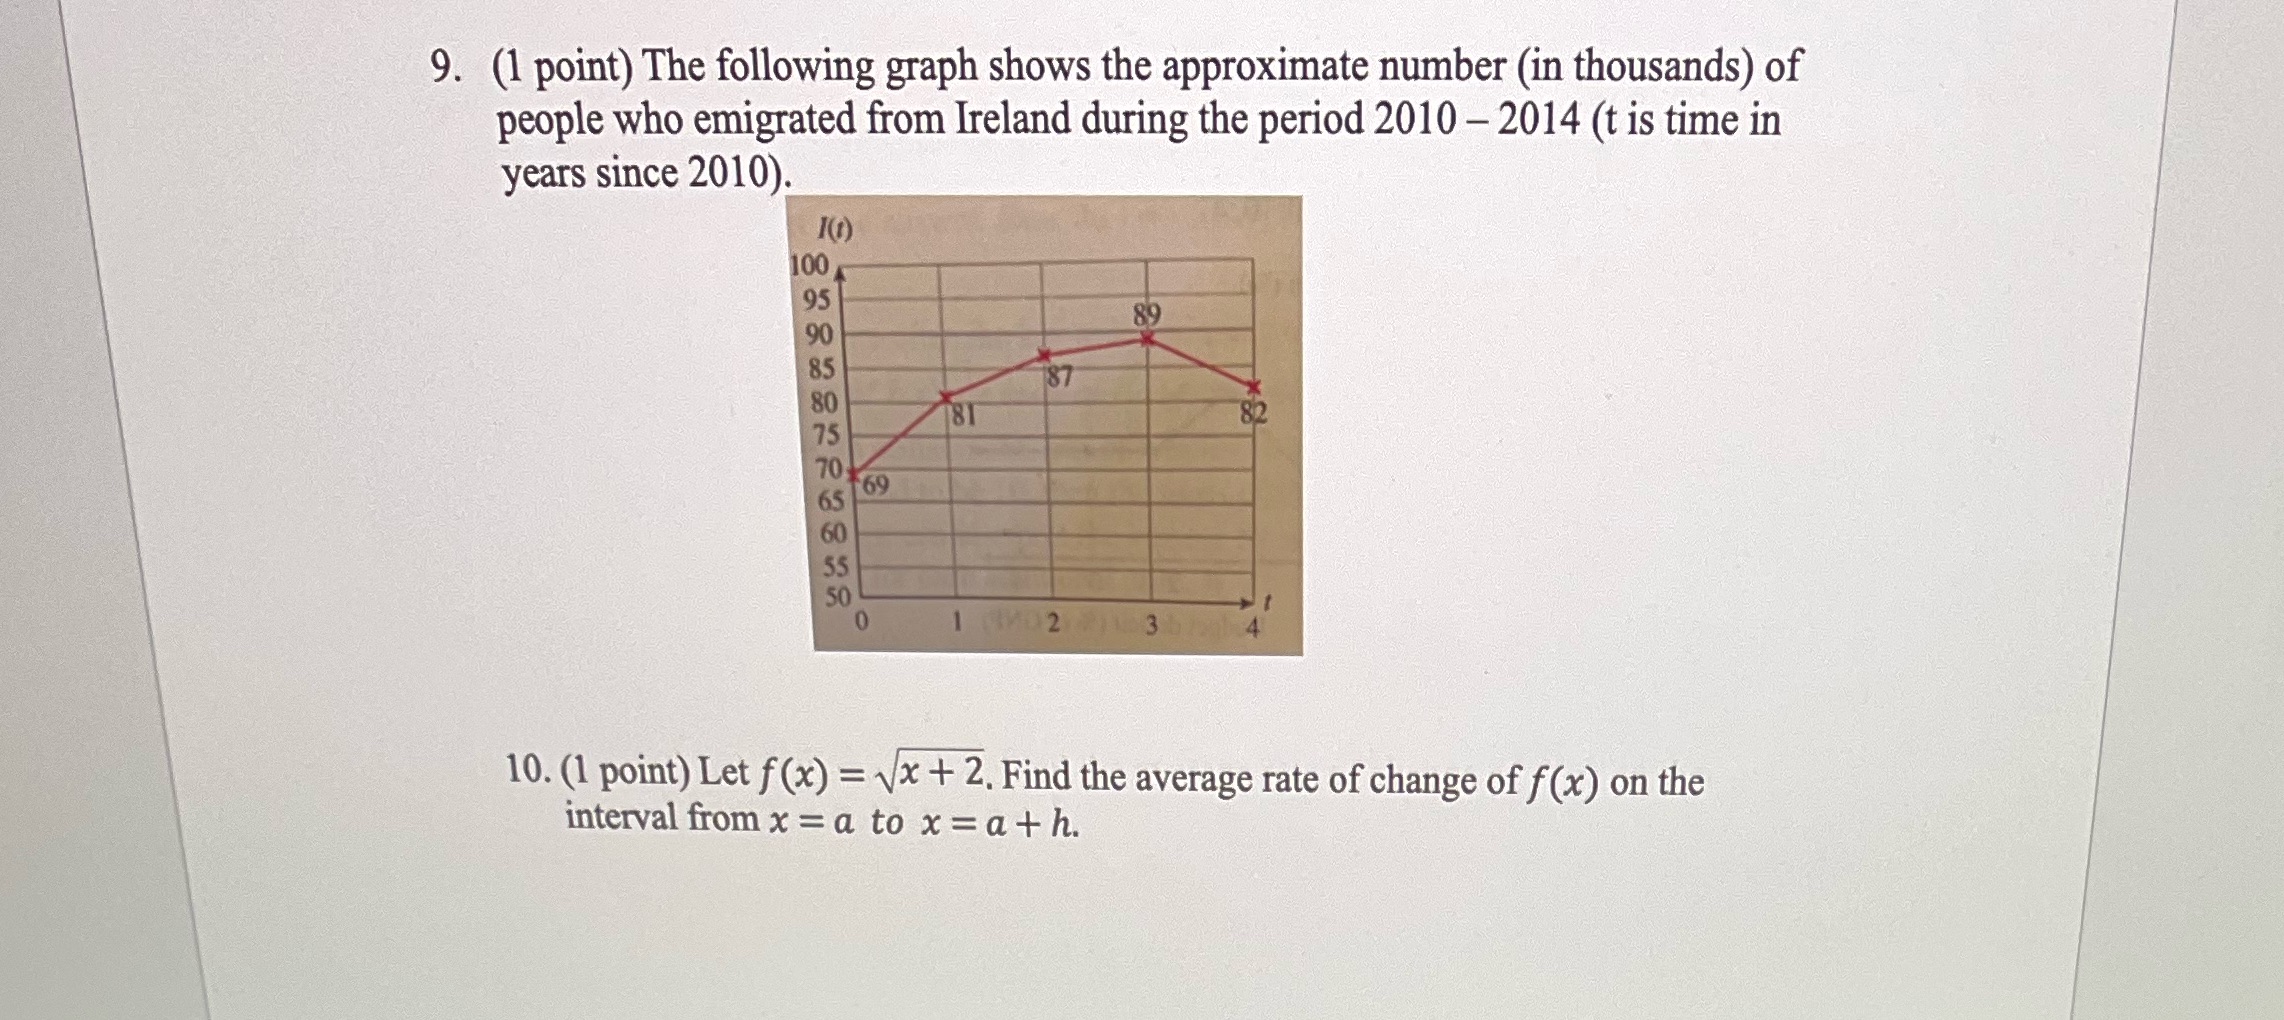
9. (1 point) The following graph shows the approximate number (in thousands) of people who emigrated from Ireland during the period 2010 - 2014 (t is time in years since 2010). 1( 1 ) 100 95 89 90 187 81 82 69 0 1 02 3 10. (1 point) Let f(x) = Vx + 2. Find the average rate of change of f (x) on the interval from x = a to x = ath
Step by Step Solution
There are 3 Steps involved in it
1 Expert Approved Answer
Step: 1 Unlock

Question Has Been Solved by an Expert!
Get step-by-step solutions from verified subject matter experts
Step: 2 Unlock
Step: 3 Unlock