

Question: show work please Problem 2: (10 points) The school board is trying to evaluate a new math program introduced to second-graders in six elementary schools
show work please
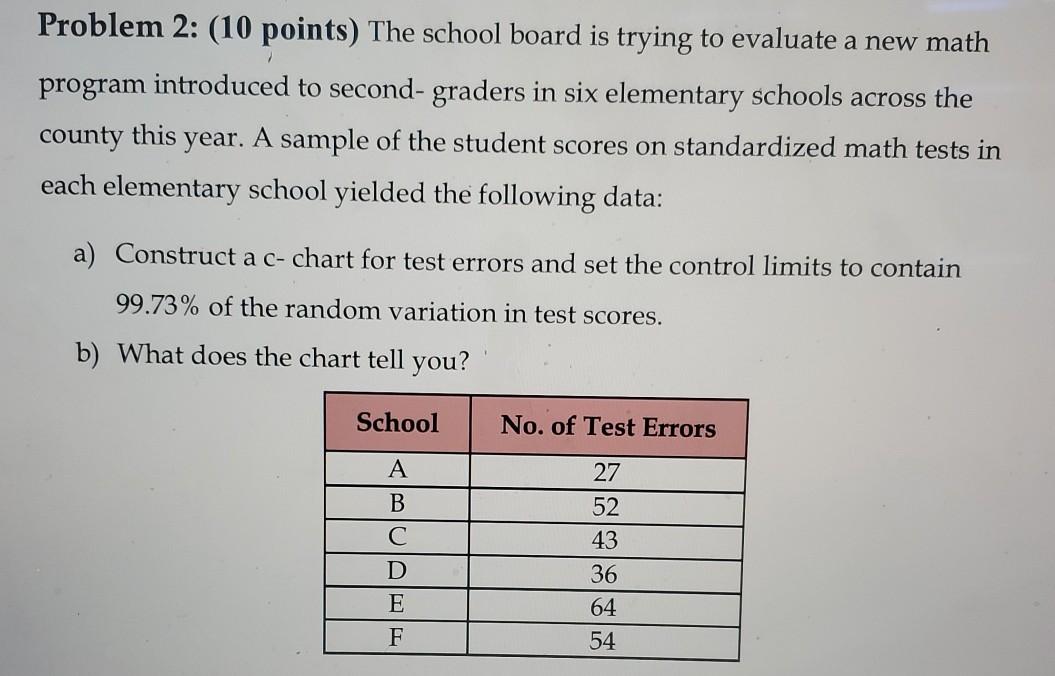
Problem 2: (10 points) The school board is trying to evaluate a new math program introduced to second-graders in six elementary schools across the county this year. A sample of the student scores on standardized math tests in A each elementary school yielded the following data: a) Construct a c-chart for test errors and set the control limits to contain 99.73% of the random variation in test scores. b) What does the chart tell you? School No. of Test Errors A B 27 52 43 36 64 54 D E FStep by Step Solution
There are 3 Steps involved in it
1 Expert Approved Answer
Step: 1 Unlock

Question Has Been Solved by an Expert!
Get step-by-step solutions from verified subject matter experts
Step: 2 Unlock
Step: 3 Unlock