

Question: show work using microsoft excel please also explain step by step process of the work. thank you. B. NPV analysis 1. XYZ forecasts the following
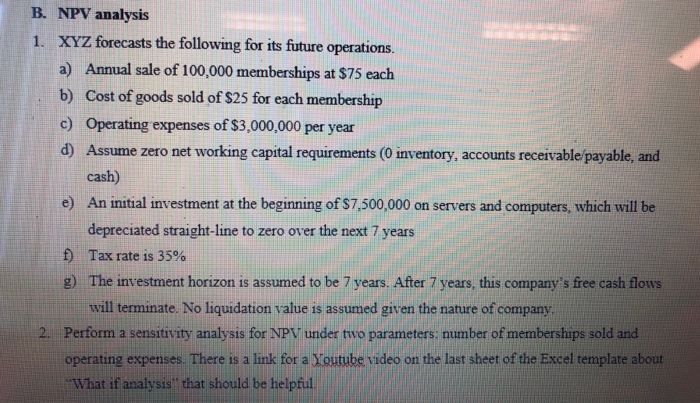
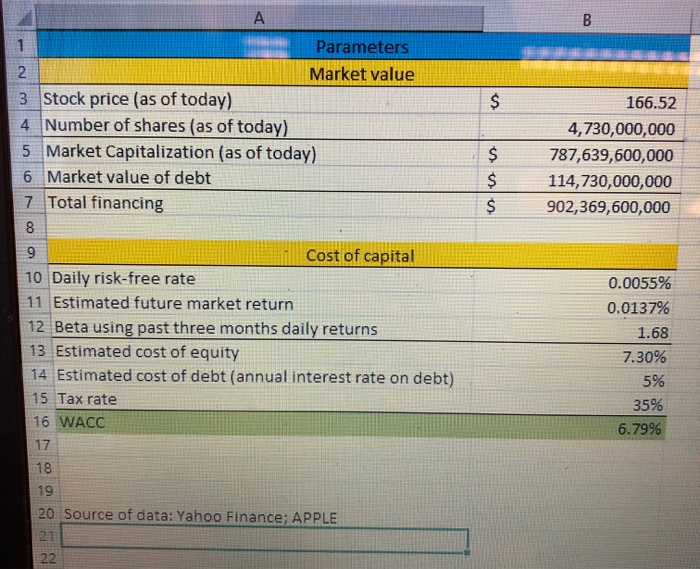
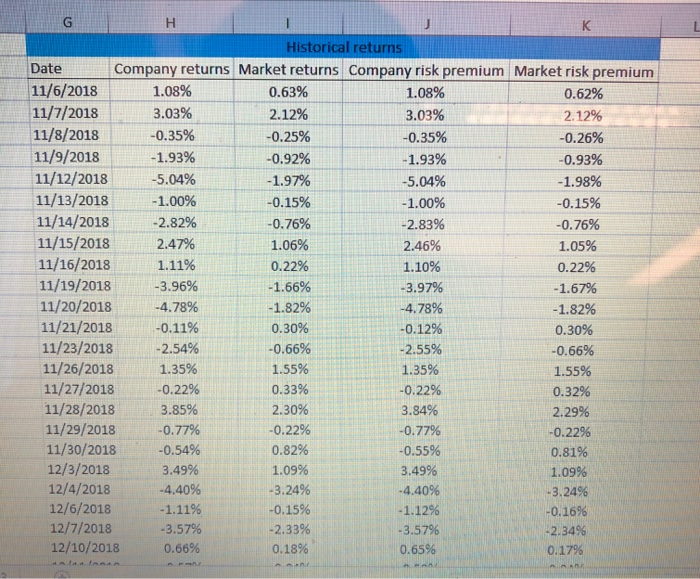
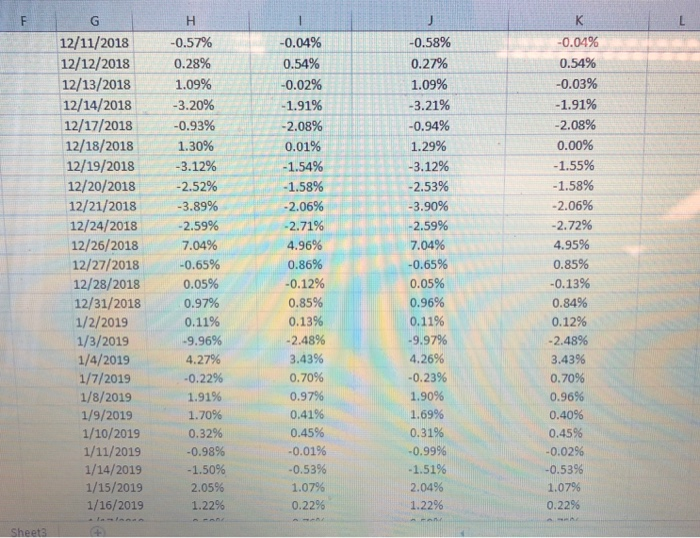
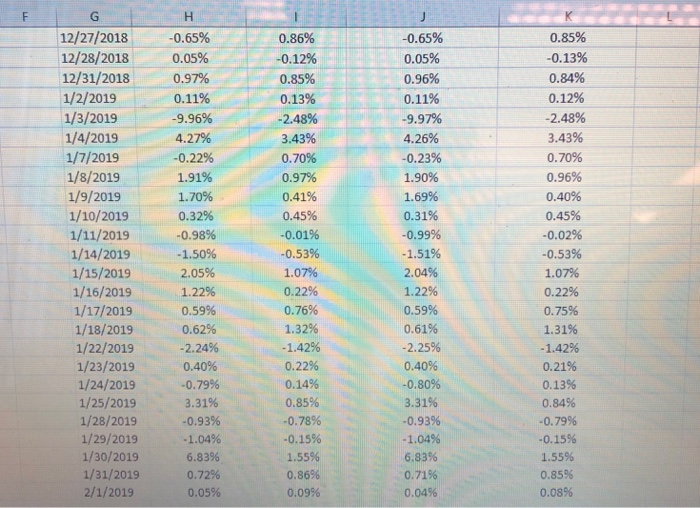
B. NPV analysis 1. XYZ forecasts the following for its future operations a) Annual sale of 100,000 memberships at $75 each b) Cost of goods sold of $25 for each membership c) Operating expenses of $3,000,000 per year d) Assume zero net working capital requirements (O inventory, accounts receivable/payable, and cash) e) An initial investment at the beginning of $7,500,000 on servers and computers, which will be depreciated straight-line to zero over the next 7 years f) Tax rate is 35% g) The investment horizon is assumed to be 7 years. After 7 years, this company's free cash flows will terminate. No liquidation value is assumed given the nature of company. 2. Perform a sensitivity analysis for NPV under two parameters: number of memberships sold and operating expenses. There is a link for a Youtube video on the last sheet of the Excel template about "What if analysis that should be helpful. Parameters Market value 3 Stock price (as of today) 4 Number of shares (as of today) 5 Market Capitalization (as of today) 6 Market value of debt 7 Total financing us 166.52 4,730,000,000 787,639,600,000 114,730,000,000 902,369,600,000 00 Cost of capital 10 Daily risk-free rate 11 Estimated future market return 12 Beta using past three months daily returns 13 Estimated cost of equity 14 Estimated cost of debt (annual interest rate on debt) 15 Tax rate 16 WACC 0.0055% 0.0137% 1.68 7.30% 5% 35% 6.79% 20 Source of data: Yahoo Finance; APPLE Historical returns Date Company returns Market returns Company risk premium Market risk premium 11/6/2018 1.08% 0.63% 1.08% 0.62% 11/7/2018 3.03% 2.12% 3.03% 2.12% 11/8/2018 -0.35% -0.25% -0.35% -0.26% 11/9/2018 -1.93% -0.92% -1.93% -0.93% 11/12/2018 -5.04% -1.97% -5.04% -1.98% 11/13/2018 -1.00% -0.15% -1.00% -0.15% 11/14/2018 -2.82% -0.76% -2.83% -0.76% 11/15/2018 2.47% 1.06% 2.46% 1.05% 11/16/2018 1.11% 0.22% 1.10% 0.22% 11/19/2018 -3.96% -1.66% -3.97% -1.67% 11/20/2018 -4.78% -1.82% -4.78% -1.82% 11/21/2018 -0.11% 0.30% -0.12% 0.30% 11/23/2018 -2.54% -0.66% -2.55% -0.66% 11/26/2018 1.35% 1.55% 1.35% 1.55% 11/27/2018 -0.22% 0.33% -0.22% 0.32% 11/28/2018 3.85% 2.30% 3.84% 2.29% 11/29/2018 -0.77% -0.22% -0.77% -0.22% 11/30/2018 -0.54% 0.82% -0.55% 0.81% 12/3/2018 3.49% 1.09% 3.49% 1.09% 12/4/2018 -4.40% -3.24% -4.40% -3.24% 12/6/2018 -1.11% -0.15% -1.12% -0.16% 12/7/2018 -3.57% -2.33% -3.57% -2.34% 12/10/2018 0.66% 0.18% 0.65% 0.17% -0.04% 0.54% -0.02% -1.91% -2.08% 0.01% -1.54% -1.58% -2.06% -2.71% 12/11/2018 12/12/2018 12/13/2018 12/14/2018 12/17/2018 12/18/2018 12/19/2018 12/20/2018 12/21/2018 12/24/2018 12/26/2018 12/27/2018 12/28/2018 12/31/2018 1/2/2019 1/3/2019 1/4/2019 1/7/2019 1/8/2019 1/9/2019 1/10/2019 1/11/2019 1/14/2019 1/15/2019 1/15/2019 -0.57% 10.28% 1.09% -3.20% -0.93% 1.30% -3.12% -2.52% -3.89% -2.59% 17.04% -0.65% 0.05% 0.97% 0.11% -9.96% 4.27% -0.22% 1.91% 1.70% 0.32% -0.98% -1.50% 2.05% 1.22% 4.96% 0.86% -0.12% -0.58% 0.27% 1.09% -3.21% -0.94% 1.29% -3.12% -2.53% -3.90% -2.59% 7.04% -0.65% 0.05% 0.96% 0.11% -9.97% 4.26% -0.23% 1.90% 1.69% 0.31% -0.99% -1.51% 2.04% 1.22% -0.04% 0.54% -0.03% -1.91% -2.08% 0.00% -1.55% -1.58% -2.06% -2.72% 4.95% 0.85% -0.13% 0.84% 0.12% -2.48% 3.43% 0.70% 0.96% 0.40% 0.45% -0.02% -0.53% 1.07% 0.35% 0.13% 2.48% 3.43% 0.706 10.976 0.41% 0.45% -0.01% -0.53% 1.07% 0.22% --- 22 - 0.86% -0.12% 0.85% 0.13% -2.48% 3.43% 0.70% 0.97% 0.41% G 12/27/2018 12/28/2018 12/31/2018 1/2/2019 1/3/2019 1/4/2019 1/7/2019 1/8/2019 1/9/2019 1/10/2019 1/11/2019 1/14/2019 1/15/2019 1/16/2019 1/17/2019 1/18/2019 1/22/2019 1/23/2019 1/24/2019 1/25/2019 1/28/2019 1/29/2019 1/30/2019 1/31/2019 2/1/2019 H -0.65% 0.05% 0.97% 0.11% -9.96% 4.27% -0.22% 1.91% 1.70% 0.32% -0.98% -1.50% 2.05% 1.22% .59% 0.62% -2.24% 0.40% -0.79% 3.31% -0.93% -1.04% 6.83% 0.72% 0.05% -0.65% 0.05% 0.96% 0.11% -9.97% 4.26% -0.23% 1.90% 1.69% 0.31% -0.99% -1.51% 2.04% 1.22% 0.59% 0.61% -2.25% 0.40% -0.80% 3.31% -0.93% -1.04% 6.83% 0.71% 0.04% 0.45% -0.01% -0.53% 1.07% 0.22% 0.76% 1.32% -1.42% 0.22% 0.14% 0.85% -0.78% -0.15% 1.55% 0.86% 0.09% 0.85% -0.13% 0.84% 0.12% -2.48% 3.43% 0.70% 0.96% 0.40% 0.45% -0.02% -0.53% 1.07% 0.22% 0.75% 1.31% -1.42% 0.21% 0.13% 0.84% -0.79% -0.15% 1.55% 0.85% 0.08% 0
Step by Step Solution
There are 3 Steps involved in it

Get step-by-step solutions from verified subject matter experts