

Question: show work. When you are finished Sample data collected by the operator of a lathe process on a part is shown below. The operator
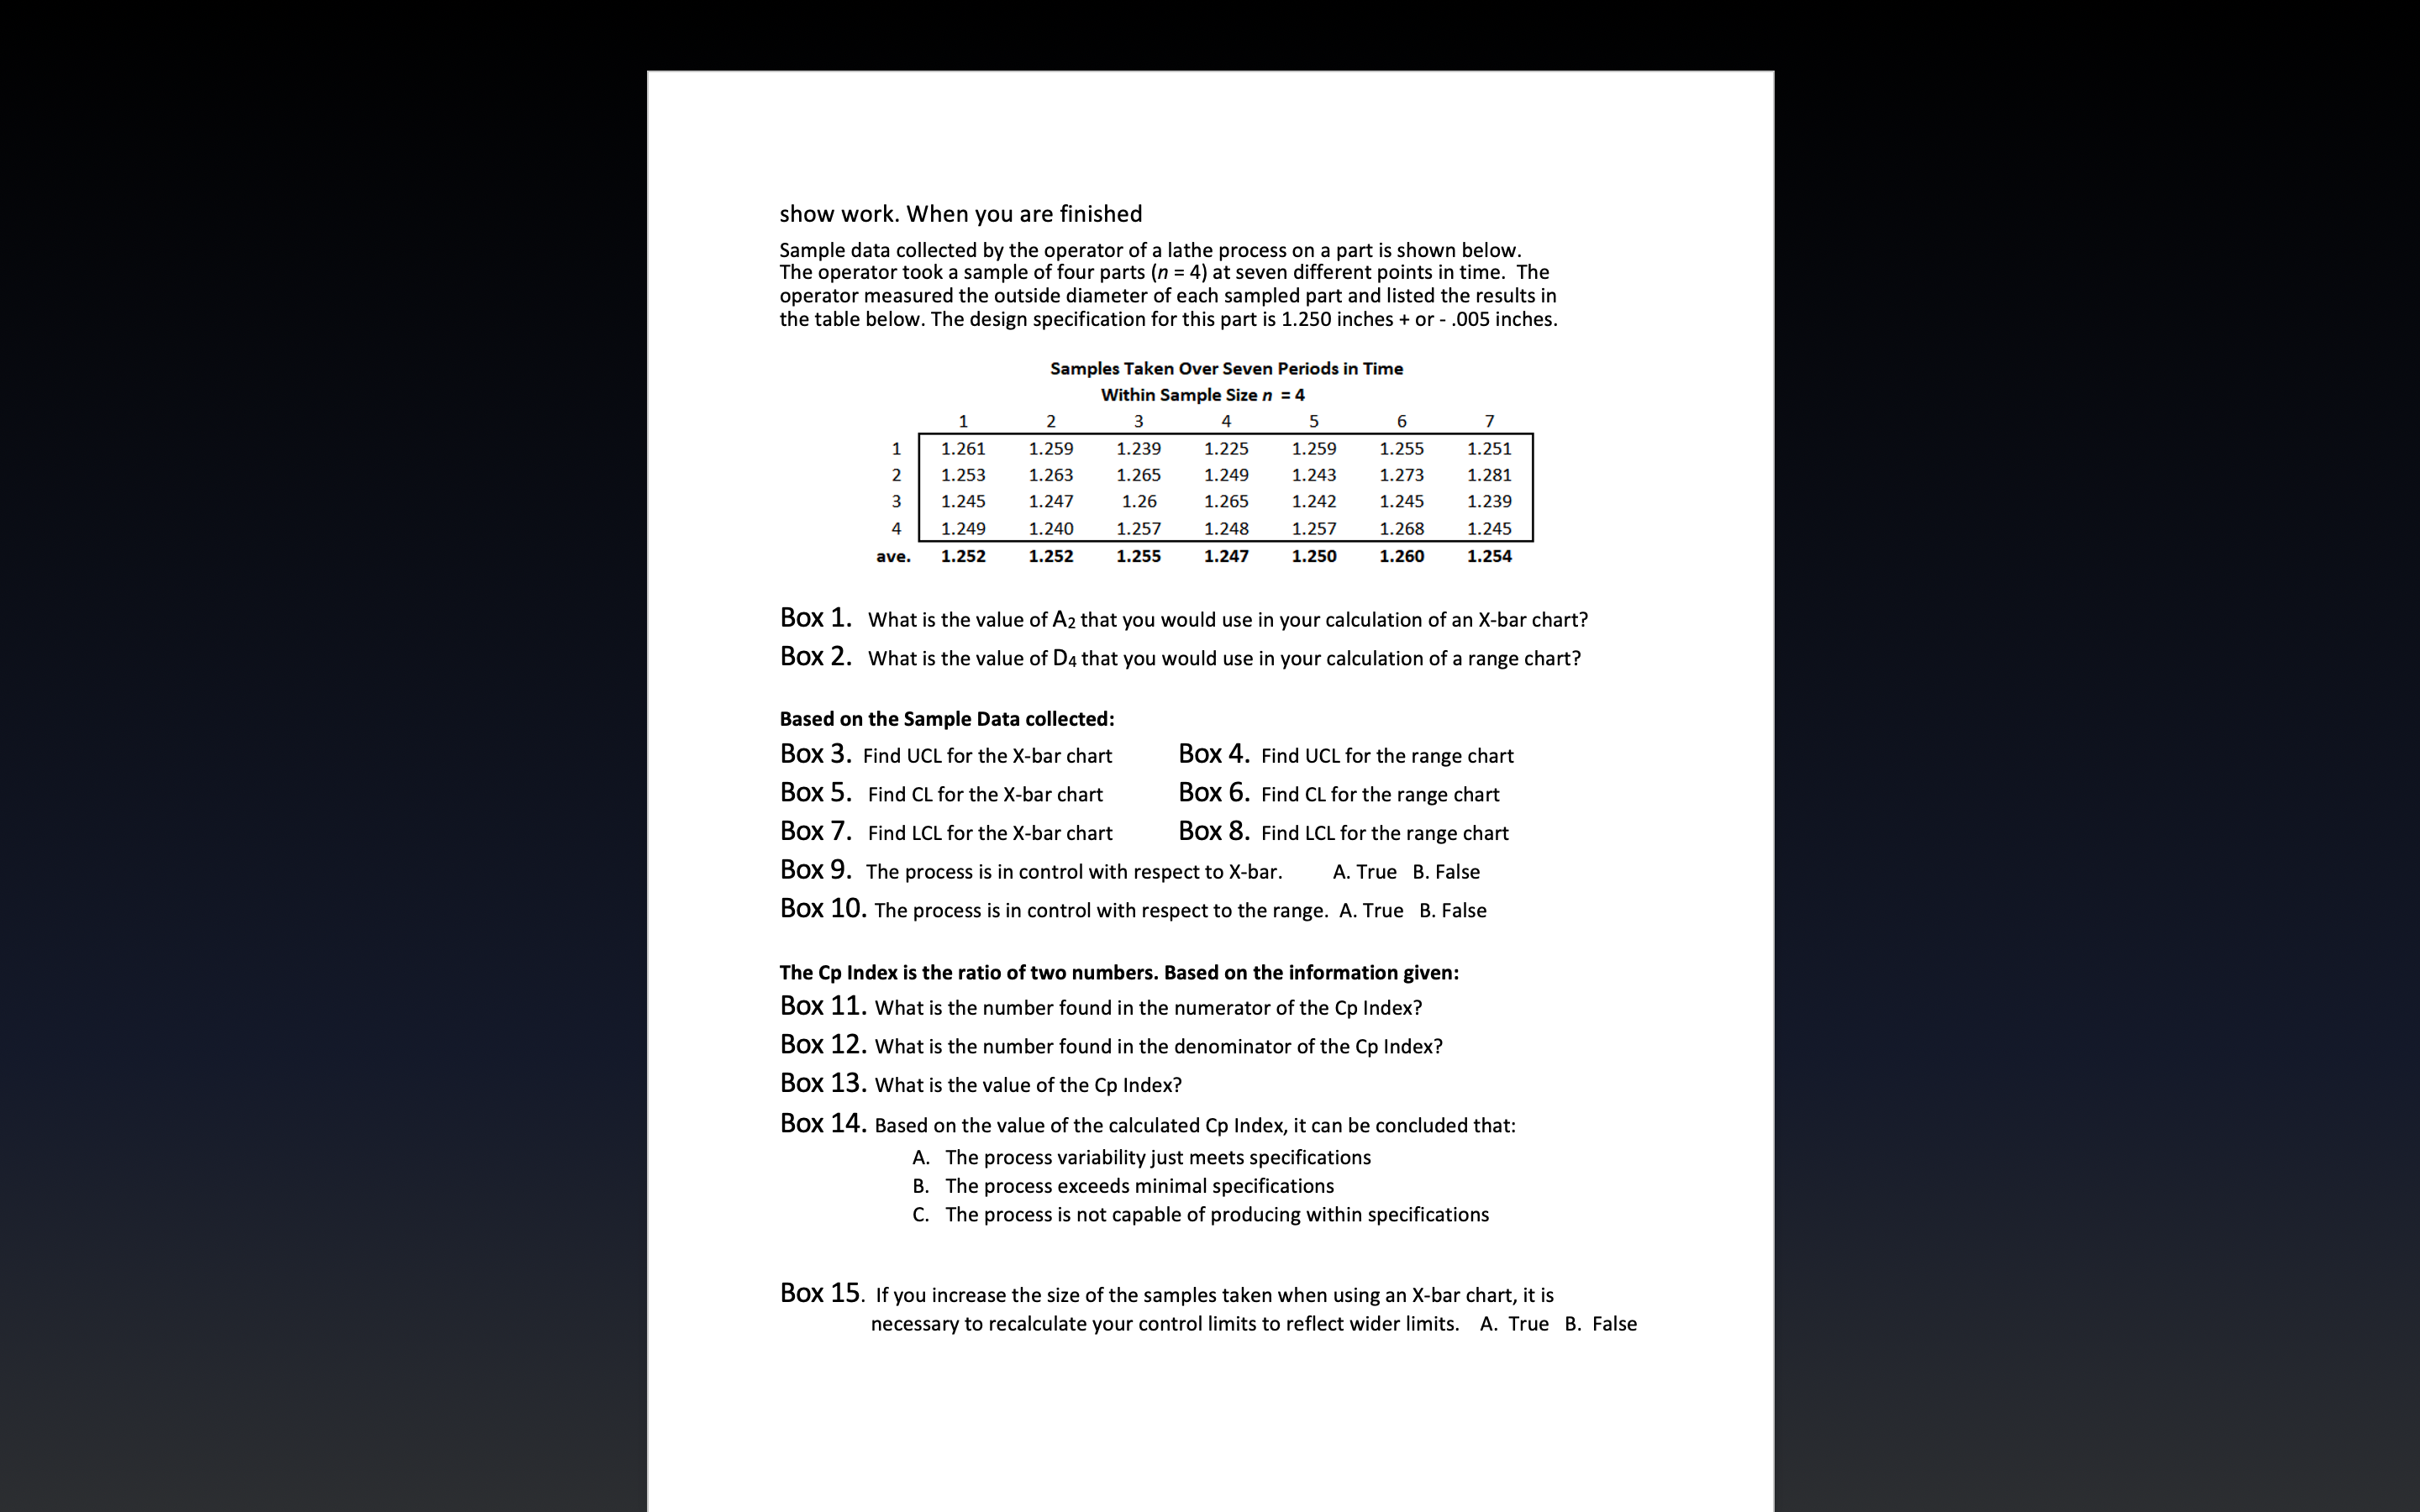
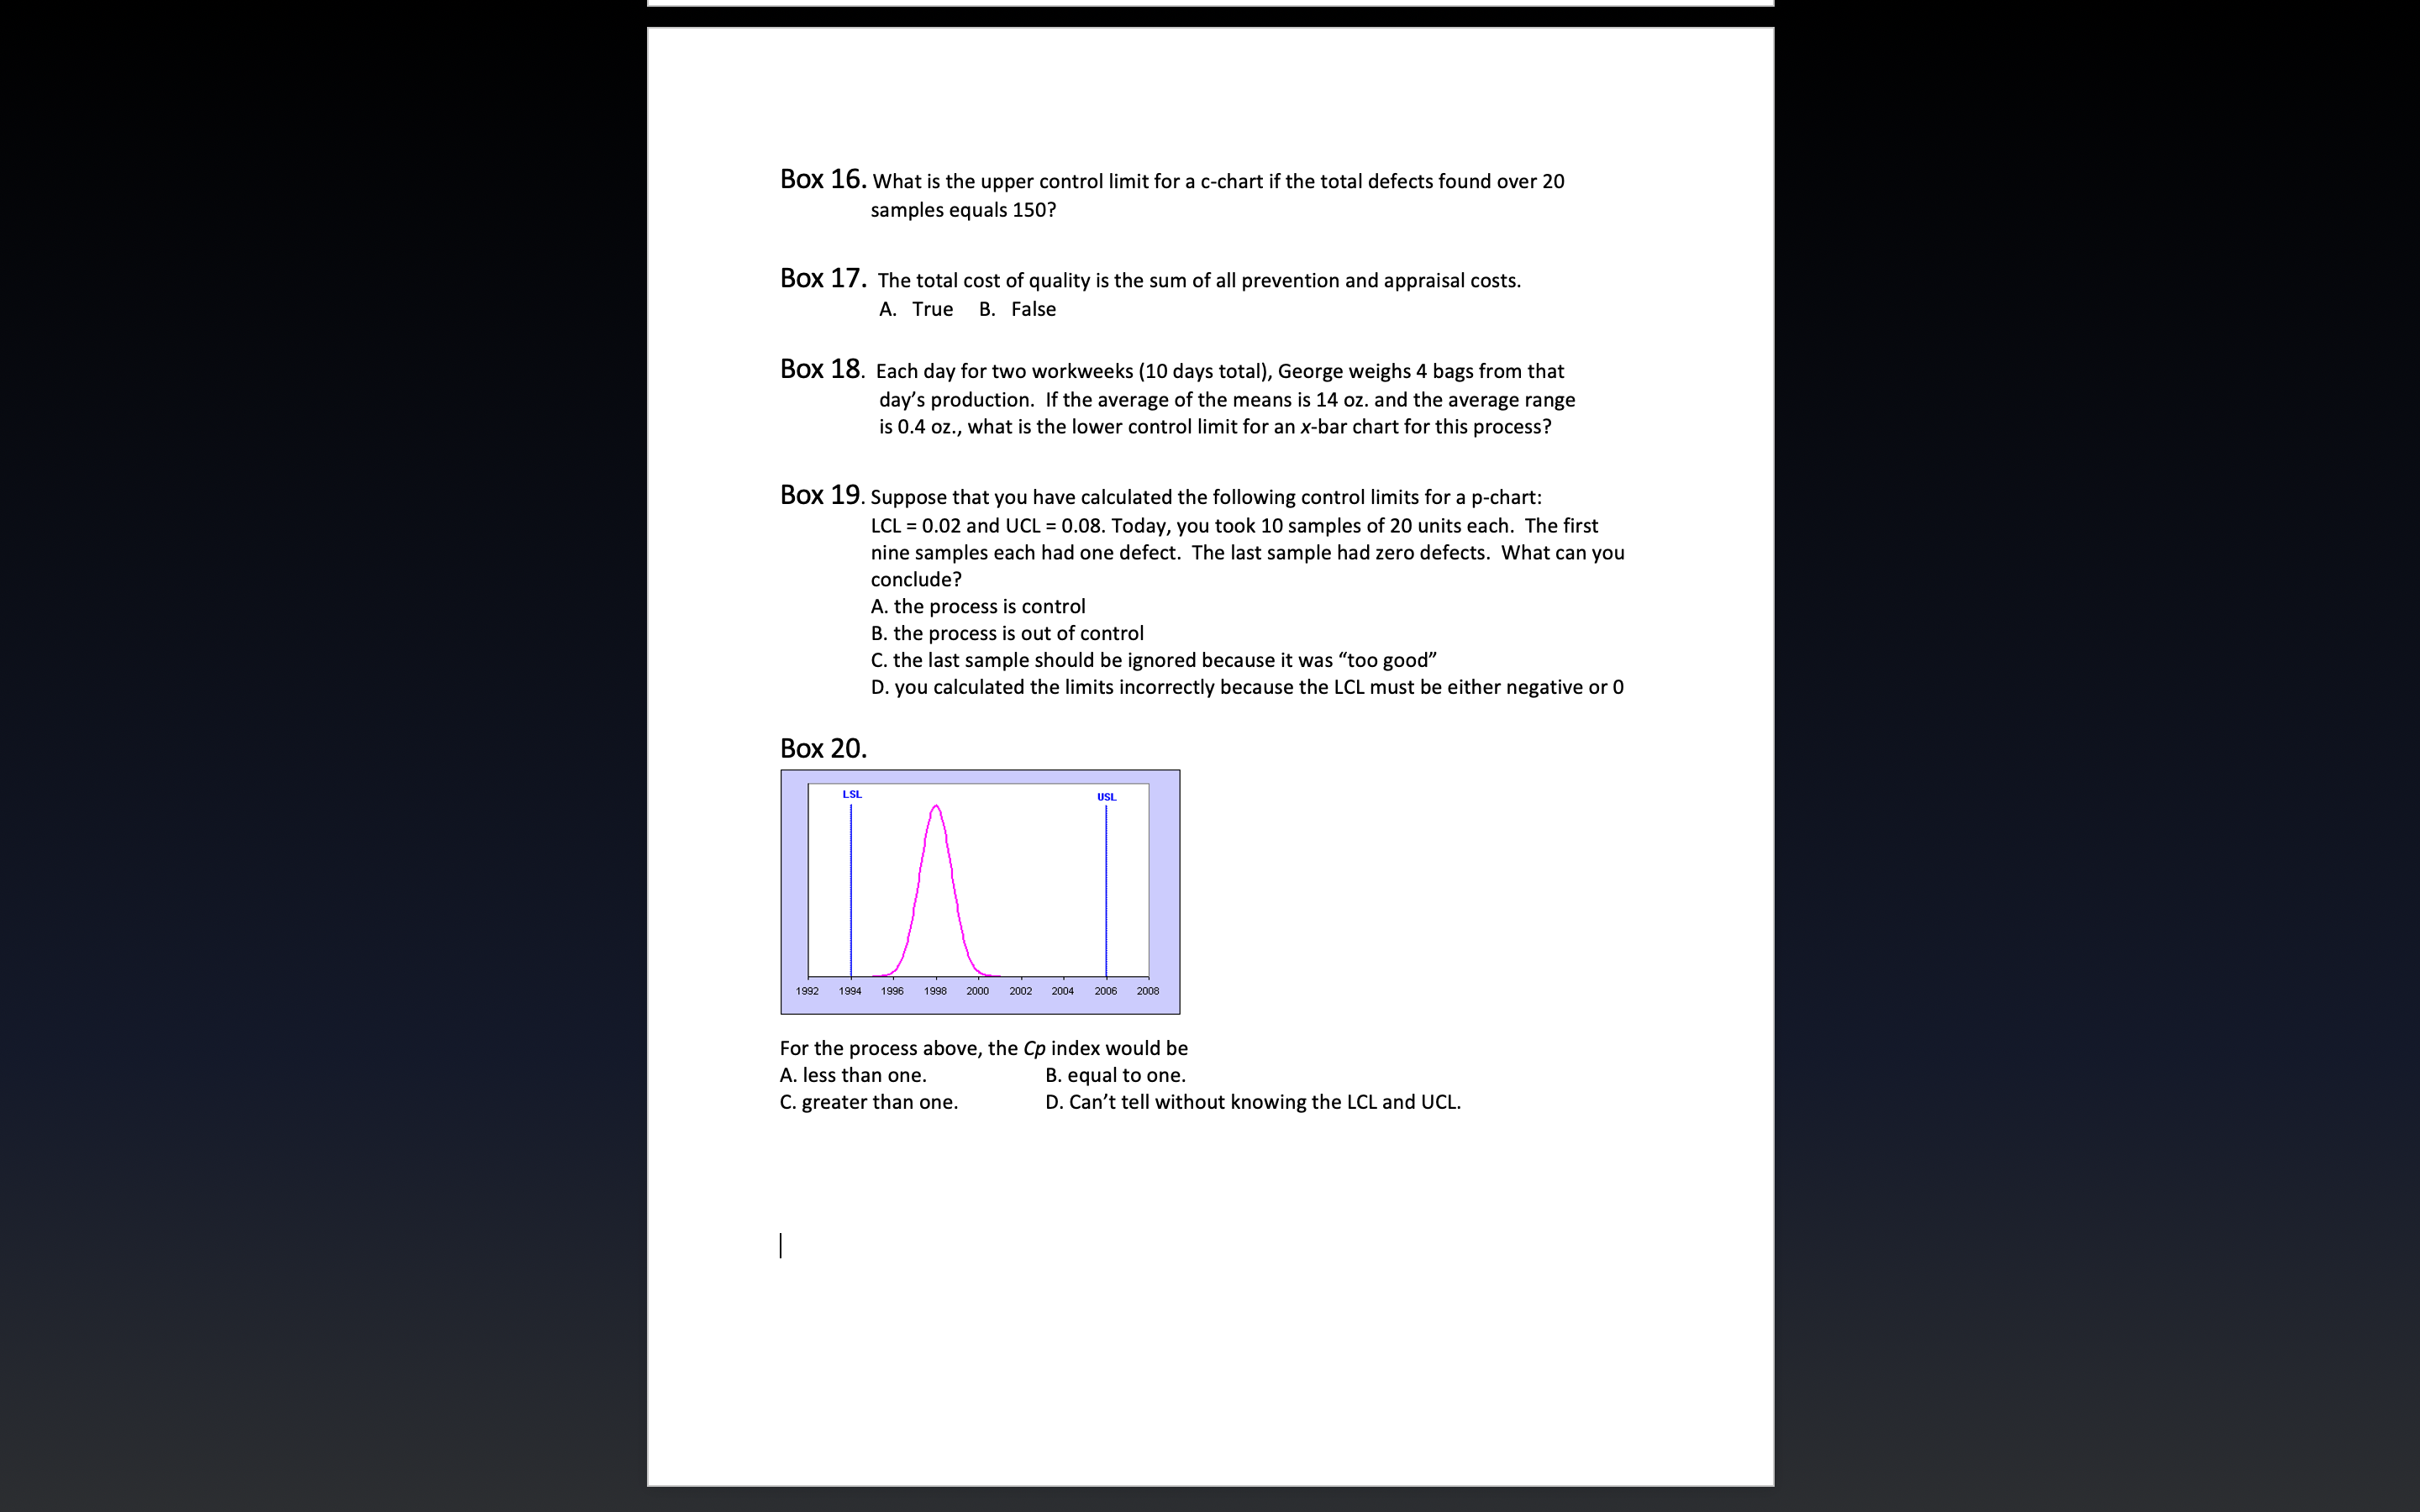
show work. When you are finished Sample data collected by the operator of a lathe process on a part is shown below. The operator took a sample of four parts (n = 4) at seven different points in time. The operator measured the outside diameter of each sampled part and listed the results in the table below. The design specification for this part is 1.250 inches + or - .005 inches. Samples Taken Over Seven Periods in Time Within Sample Size n = 4 1 2 3 4 5 6 7 1 1.261 1.259 1.239 1.225 1.259 1.255 1.251 2 1.253 1.263 1.265 1.249 1.243 1.273 1.281 3 1.245 1.247 1.26 1.265 1.242 1.245 1.239 4 1.249 1.240 1.257 1.248 1.257 1.268 1.245 ave. 1.252 1.252 1.255 1.247 1.250 1.260 1.254 Box 1. What is the value of A2 that you would use in your calculation of an X-bar chart? Box 2. What is the value of D4 that you would use in your calculation of a range chart? Based on the Sample Data collected: Box 3. Find UCL for the X-bar chart Box 4. Find UCL for the range chart Box 5. Find CL for the X-bar chart Box 6. Find CL for the range chart Box 7. Find LCL for the X-bar chart Box 8. Find LCL for the range chart Box 9. The process is in control with respect to X-bar. A. True B. False Box 10. The process is in control with respect to the range. A. True B. False The Cp Index is the ratio of two numbers. Based on the information given: Box 11. What is the number found in the numerator of the Cp Index? Box 12. What is the number found in the denominator of the Cp Index? Box 13. What is the value of the Cp Index? Box 14. Based on the value of the calculated Cp Index, it can be concluded that: A. The process variability just meets specifications B. The process exceeds minimal specifications C. The process is not capable of producing within specifications Box 15. If you increase the size of the samples taken when using an X-bar chart, it is necessary to recalculate your control limits to reflect wider limits. A. True B. False Box 16. What is the upper control limit for a c-chart if the total defects found over 20 samples equals 150? Box 17. The total cost of quality is the sum of all prevention and appraisal costs. A. True B. False Box 18. Each day for two workweeks (10 days total), George weighs 4 bags from that day's production. If the average of the means is 14 oz. and the average range is 0.4 oz., what is the lower control limit for an x-bar chart for this process? Box 19. Suppose that you have calculated the following control limits for a p-chart: LCL = 0.02 and UCL = 0.08. Today, you took 10 samples of 20 units each. The first nine samples each had one defect. The last sample had zero defects. What can you conclude? Box 20. A. the process is control B. the process is out of control C. the last sample should be ignored because it was "too good" D. you calculated the limits incorrectly because the LCL must be either negative or 0 LSL 1992 1994 1996 1998 2000 2002 USL 2004 2006 2008 For the process above, the Cp index would be A. less than one. C. greater than one. B. equal to one. D. Can't tell without knowing the LCL and UCL.
Step by Step Solution
There are 3 Steps involved in it

Get step-by-step solutions from verified subject matter experts