

Question: Show workings for each set of calculations. Note: Case Study 1 FACT SET Go to yahoofinance.com.au and obtain: o the closing adjusted price for Domino
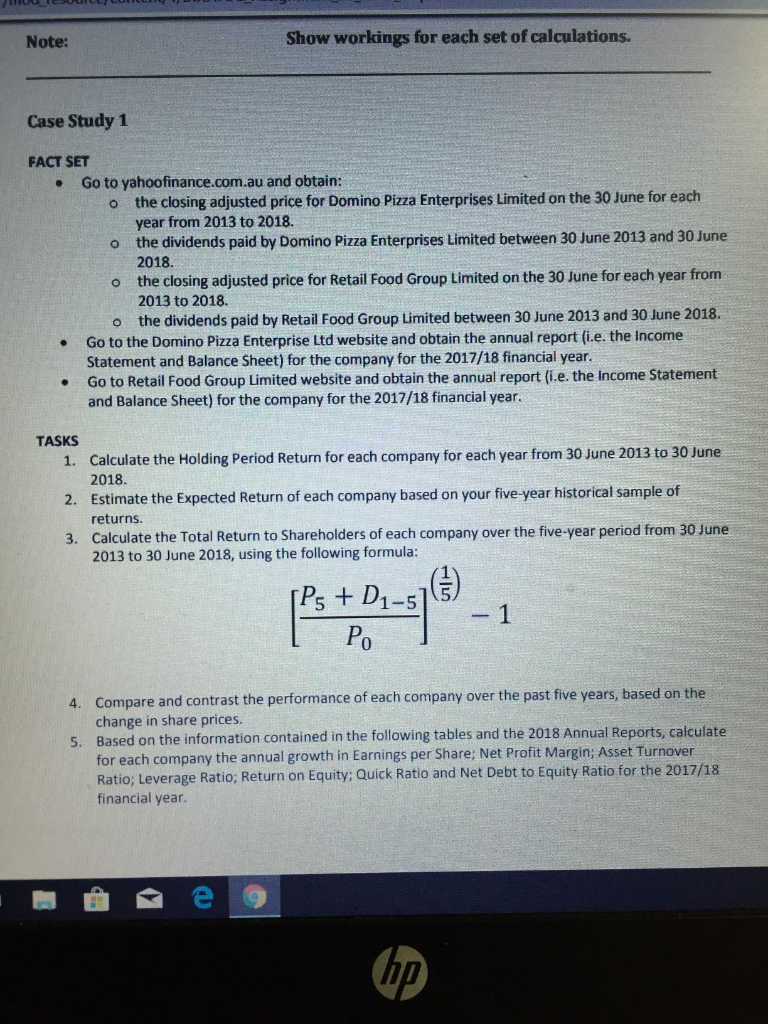
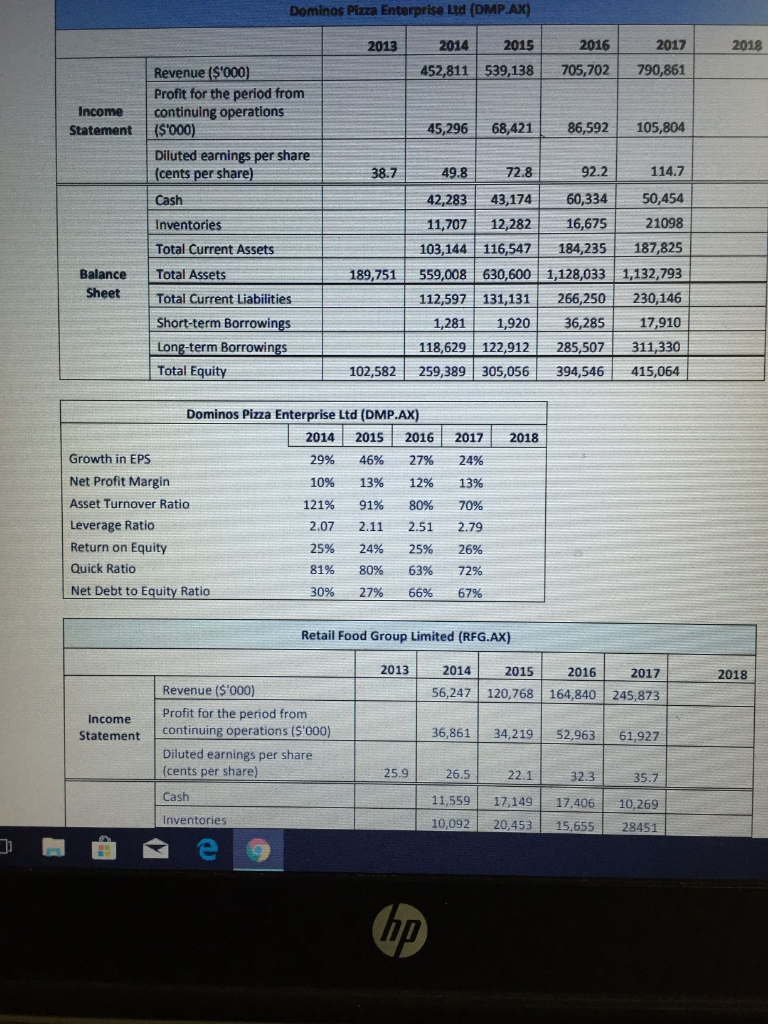
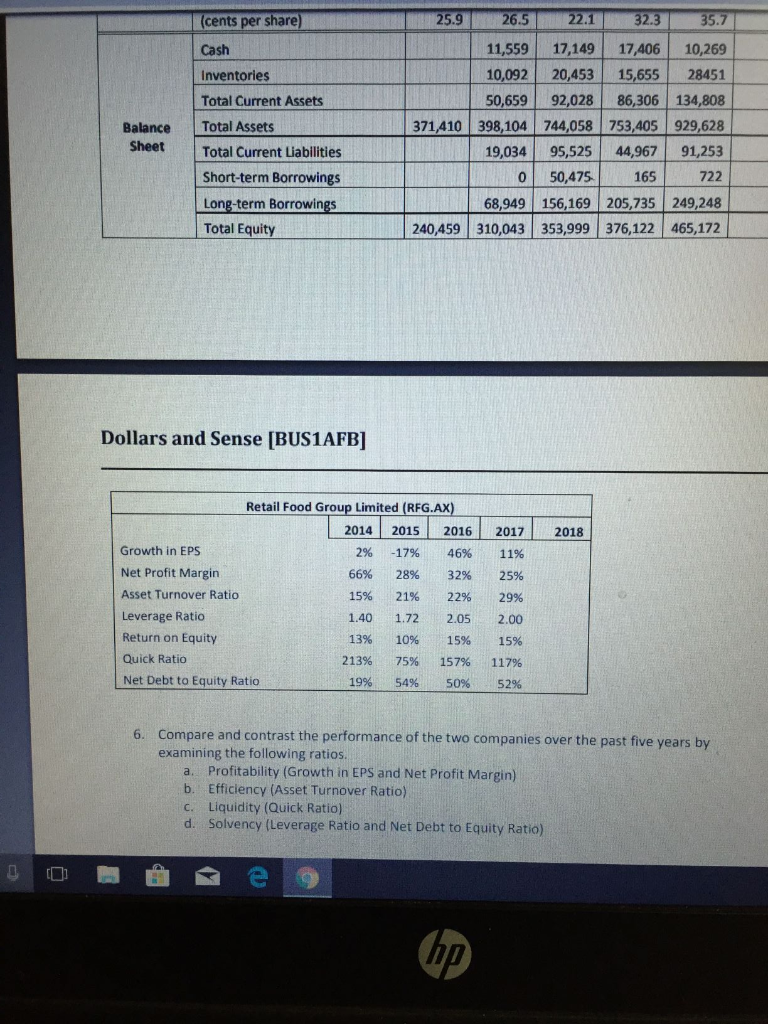
Show workings for each set of calculations. Note: Case Study 1 FACT SET Go to yahoofinance.com.au and obtain: o the closing adjusted price for Domino Pizza Enterprises Limited on the 30 June for each year from 2013 to 2018 o the dividends paid by Domino Pizza Enterprises Limited between 30 June 2013 and 30 June 2018. the closing adjusted price for Retail Food Group Limited on the 30 June for each year from o 2013 to 2018. o the dividends paid by Retail Food Group Limited between 30 June 2013 and 30 June 2018. Go to the Domino Pizza Enterprise Ltd website and obtain the annual report (i.e. the income Statement and Balance Sheet) for the company for the 2017/18 financial year .Go to Retail Food Group Limited website and obtain the annual report (i.e. the Income Statement and Balance Sheet) for the company for the 2017/18 financial year. TASKS Calculate the Holding Period Return for each company for each year from 30 June 2013 to 30 June 1. 2018 Estimate the Expected Return of each company based on your five-year historical sample of 2. returns. 3. Calculate the Total Return to Shareholders of each company over the five-year period from 30 June 2013 to 30 June 2018, using the following formula: 1 Ps D1-515 Compare and contrast the performance of each company over the past five years, based on the 4. change in share prices. ased on the information contained in the following tables and the 2018 Annual Reports, calculate 5. B for each company the annual growth in Earnings per Share; Net Profit Margin; Asset Turnover Ratio; Leverage Ratio; Return on Equity: Quick Ratio and Net Debt to Equity Ratio for the 2017/18 financial year. Dominos Pizza Enterprise Ltd (DMP.AX) 2013 2014 201s 2016 20101 452,811 539,138 705,702 790,861 Revenue ($000) Profit for the period from continuing operations Income Statement (5'000) 45,296 68,42186,592 105.804 Diluted earnings per share (cents per share 38.749.872.8 92.2 114.7 42,283 43174 60,334 50,454 11,707 12282 16,67521098 103,144 116,547 184,235 187,825 Cash Inventories Total Current Assets Balance Total Assets 189,751 559,008 630,600 1,128,033 1,132,793 Sheet Total Current Liabilities 112,597 131,131 266,250 230,146 Short-term Borrowings 1,281 1,92036,285 17.910 118,629 122,912285,507 311,330 Long-term Borrowings Total Equity 102,582 259,389 305,056 394,546415,064 Dominos Pizza Eterprise Ltd (DMP.AX) 2014 2015 2016 2017 2018 Growth in EPS 29% 46% 27% 24% Net Profit Margin 10% 13% 12% 13% Asset Turnover Ratio 121% 91% 80% 70% Leverage Ratio 2.07 2.11 2.51 2.79 Return on Equity 25% 24% 25% 26% Quick Ratico 81% 80% 63% 72% Net Debt to Equity Ratio 30% 27% 66% 67% Retail Food Group Limited (RFG.AX) 20132014201520162017 2018 Revenue ($'000 56,247 120,768 164,840 245,873 Profit for the period from Statement continuing operations 15000) Income 36,861 34,21952,963 61,927 Diluted earnings per share (cents per share 25.9 26.5 22.1 32.3 35.7 Cash 11,559 17.149 17.406 10,269 10,092 20,453 15,655 28451 Inventories e o 25.9 26.5 22.132.33 (cents per share 35.7 11,559 17,149 17406 10,269 10,092 20,453 15,655 28451 Cash Inventories 50,659 92,028 86,306 134,808 371410 398,104 744,058 753,405 929,628 Total Current Assets Balance Total Assets SheetTotal Current Liabilities 19,034 95,525 44,967 91,253 0 50,475 165 722 68,949 156,169 205,735 249,248 240,459 310,043 353,999 376,122 465,172 Short-term Borrowings Long-term Borrowings Total Equity Dollars and Sense [BUS1AFB] Retail Food Group Limited (RFG.AX) 2014 2015 201620172018 Growth in EPS 2% -17% 46% 11% Net Profit Margin 66% 28% 32% 25% Asset Turnover Ratio 15% 21% 22% 29% Leverage Ratio 1.40 1.72 2.05 2.00 Return on Equity 13% 10% 15% 15% Quick Ratio 213% 157% 75% 117% Net Debt to Equity Ratio 19% 54% 52% 50% Compare and contrast the performance of the two companies over the past five years by examining the following ratios a. Profitability (Growth in EPS and Net Profit Margin) b. Efficiency (Asset Turnover Ratio) c. Liquidity (Quick Ratio) d. Solvency (Leverage Ratio and Net Debt to Equity Ratio) 6. 0I Show workings for each set of calculations. Note: Case Study 1 FACT SET Go to yahoofinance.com.au and obtain: o the closing adjusted price for Domino Pizza Enterprises Limited on the 30 June for each year from 2013 to 2018 o the dividends paid by Domino Pizza Enterprises Limited between 30 June 2013 and 30 June 2018. the closing adjusted price for Retail Food Group Limited on the 30 June for each year from o 2013 to 2018. o the dividends paid by Retail Food Group Limited between 30 June 2013 and 30 June 2018. Go to the Domino Pizza Enterprise Ltd website and obtain the annual report (i.e. the income Statement and Balance Sheet) for the company for the 2017/18 financial year .Go to Retail Food Group Limited website and obtain the annual report (i.e. the Income Statement and Balance Sheet) for the company for the 2017/18 financial year. TASKS Calculate the Holding Period Return for each company for each year from 30 June 2013 to 30 June 1. 2018 Estimate the Expected Return of each company based on your five-year historical sample of 2. returns. 3. Calculate the Total Return to Shareholders of each company over the five-year period from 30 June 2013 to 30 June 2018, using the following formula: 1 Ps D1-515 Compare and contrast the performance of each company over the past five years, based on the 4. change in share prices. ased on the information contained in the following tables and the 2018 Annual Reports, calculate 5. B for each company the annual growth in Earnings per Share; Net Profit Margin; Asset Turnover Ratio; Leverage Ratio; Return on Equity: Quick Ratio and Net Debt to Equity Ratio for the 2017/18 financial year. Dominos Pizza Enterprise Ltd (DMP.AX) 2013 2014 201s 2016 20101 452,811 539,138 705,702 790,861 Revenue ($000) Profit for the period from continuing operations Income Statement (5'000) 45,296 68,42186,592 105.804 Diluted earnings per share (cents per share 38.749.872.8 92.2 114.7 42,283 43174 60,334 50,454 11,707 12282 16,67521098 103,144 116,547 184,235 187,825 Cash Inventories Total Current Assets Balance Total Assets 189,751 559,008 630,600 1,128,033 1,132,793 Sheet Total Current Liabilities 112,597 131,131 266,250 230,146 Short-term Borrowings 1,281 1,92036,285 17.910 118,629 122,912285,507 311,330 Long-term Borrowings Total Equity 102,582 259,389 305,056 394,546415,064 Dominos Pizza Eterprise Ltd (DMP.AX) 2014 2015 2016 2017 2018 Growth in EPS 29% 46% 27% 24% Net Profit Margin 10% 13% 12% 13% Asset Turnover Ratio 121% 91% 80% 70% Leverage Ratio 2.07 2.11 2.51 2.79 Return on Equity 25% 24% 25% 26% Quick Ratico 81% 80% 63% 72% Net Debt to Equity Ratio 30% 27% 66% 67% Retail Food Group Limited (RFG.AX) 20132014201520162017 2018 Revenue ($'000 56,247 120,768 164,840 245,873 Profit for the period from Statement continuing operations 15000) Income 36,861 34,21952,963 61,927 Diluted earnings per share (cents per share 25.9 26.5 22.1 32.3 35.7 Cash 11,559 17.149 17.406 10,269 10,092 20,453 15,655 28451 Inventories e o 25.9 26.5 22.132.33 (cents per share 35.7 11,559 17,149 17406 10,269 10,092 20,453 15,655 28451 Cash Inventories 50,659 92,028 86,306 134,808 371410 398,104 744,058 753,405 929,628 Total Current Assets Balance Total Assets SheetTotal Current Liabilities 19,034 95,525 44,967 91,253 0 50,475 165 722 68,949 156,169 205,735 249,248 240,459 310,043 353,999 376,122 465,172 Short-term Borrowings Long-term Borrowings Total Equity Dollars and Sense [BUS1AFB] Retail Food Group Limited (RFG.AX) 2014 2015 201620172018 Growth in EPS 2% -17% 46% 11% Net Profit Margin 66% 28% 32% 25% Asset Turnover Ratio 15% 21% 22% 29% Leverage Ratio 1.40 1.72 2.05 2.00 Return on Equity 13% 10% 15% 15% Quick Ratio 213% 157% 75% 117% Net Debt to Equity Ratio 19% 54% 52% 50% Compare and contrast the performance of the two companies over the past five years by examining the following ratios a. Profitability (Growth in EPS and Net Profit Margin) b. Efficiency (Asset Turnover Ratio) c. Liquidity (Quick Ratio) d. Solvency (Leverage Ratio and Net Debt to Equity Ratio) 6. 0I
Step by Step Solution
There are 3 Steps involved in it

Get step-by-step solutions from verified subject matter experts