

Question: Show your complete solution. 4. Data for the progression of college students at a particular college are summarized in the following matrix of transition probabilities:
Show your complete solution.
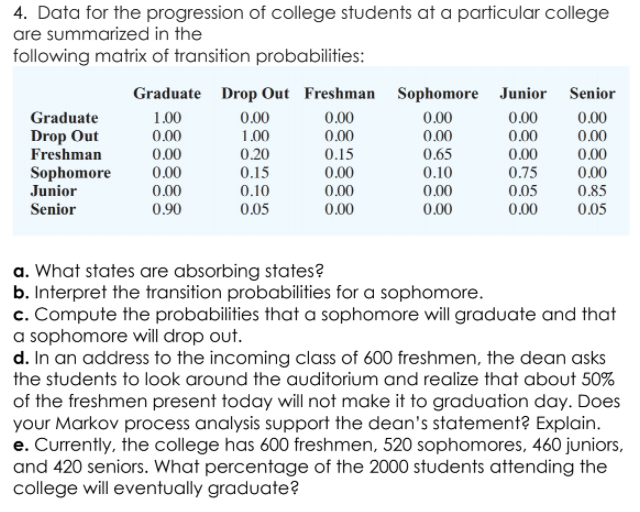
4. Data for the progression of college students at a particular college are summarized in the following matrix of transition probabilities: Graduate Drop Out Freshman Sophomore Junior Senior Graduate 1.00 0.00 0.00 0.00 0.00 0.00 Drop Out 0.00 1.00 0.00 0.00 0.00 0.00 Freshman 0.00 0.20 0.15 0.65 0.00 0.00 Sophomore 0.00 0.15 0.00 0.10 0.75 0.00 Junior 0.00 0.10 0.00 0.00 0.05 0.85 Senior 0.90 0.05 0.00 0.00 0.00 0.05 a. What states are absorbing states? b. Interpret the transition probabilities for a sophomore. c. Compute the probabilities that a sophomore will graduate and that a sophomore will drop out. d. In an address to the incoming class of 600 freshmen, the dean asks the students to look around the auditorium and realize that about 50% of the freshmen present today will not make it to graduation day. Does your Markov process analysis support the dean's statement? Explain. e. Currently, the college has 600 freshmen, 520 sophomores, 460 juniors, and 420 seniors. What percentage of the 2000 students attending the college will eventually graduate
Step by Step Solution
There are 3 Steps involved in it

Get step-by-step solutions from verified subject matter experts