

Question: Show your work for full credit. Dataset: The data below depict hypothetical data for six students. Each score represents the number of hours they reported

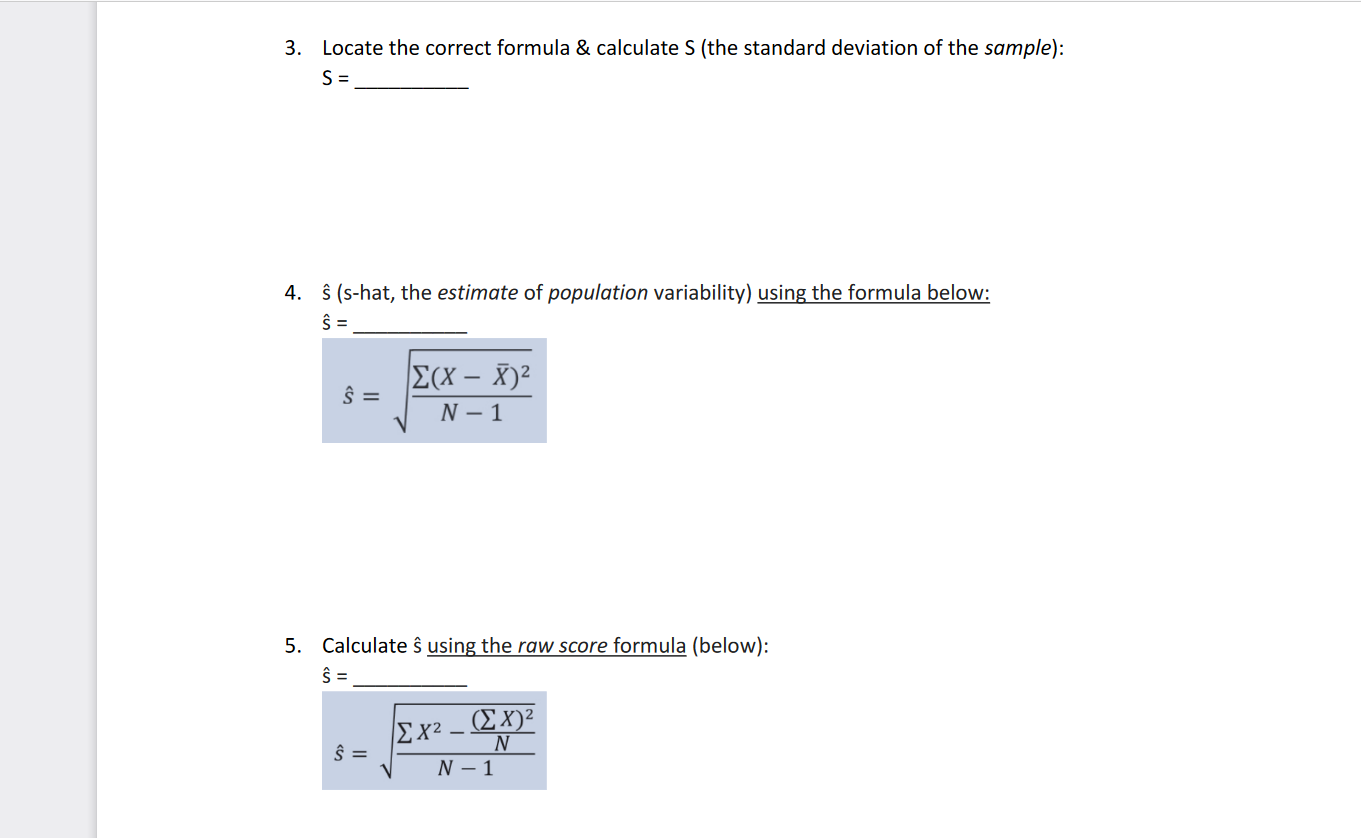
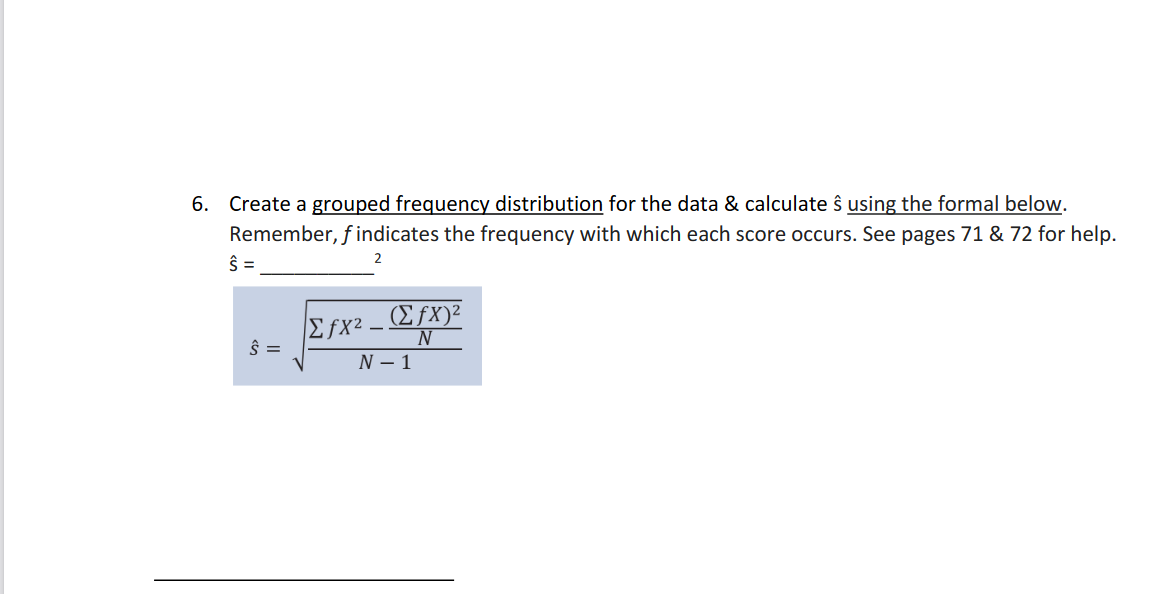
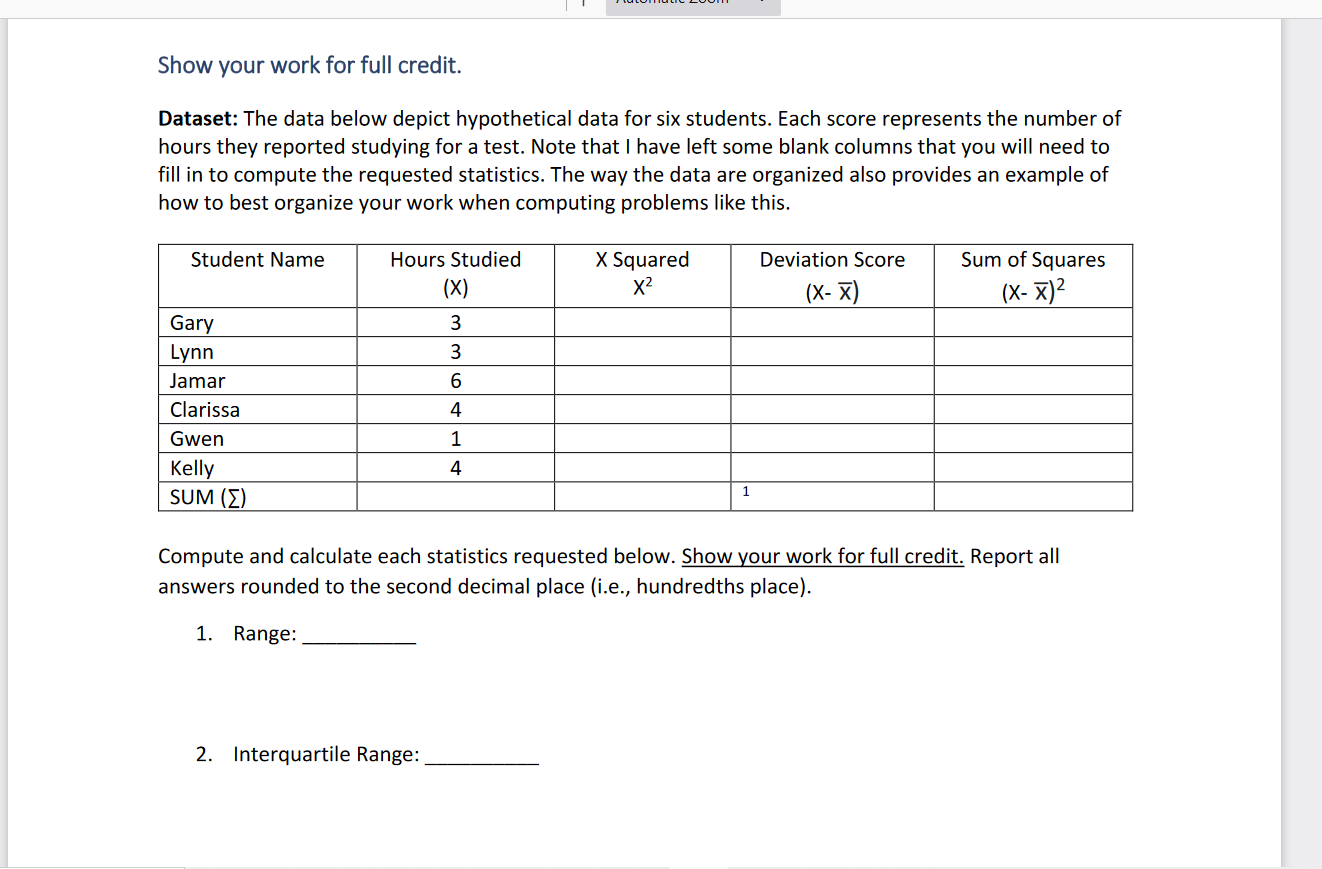


Show your work for full credit. Dataset: The data below depict hypothetical data for six students. Each score represents the number of hours they reported studying for a test. Note that l have left some blank columns that you will need to fill in to compute the requested statistics. The way the data are organized also provides an example of how to best organize your work when computing problems like this. Student Name Hours Studied X Squared Deviation Score Sum of Squares {x1 X2 (x- i) (x- XV Gary 3 Lynn 3 Jamar 6 Clarissa 4 Gwen 1 Kelly 4 SUM (Z) l Compute and calculate each statistics requested below. Show your work for full credit. Report all answers rounded to the second decimal place [i.e., hundredths place}. 1. Range: 2. Interquartile Range: 3. Locate the correct formula 8!. calculate S (the standard deviation of the sample): S : 4. (s-hat, the estimate of population variability) using the formula below: 5. Calculate 5 using the raw score formula (below): : (2X32 g EXL N N1 6. Create a grouped frequency distribution for the data & calculate s using the formal below. Remember, f indicates the frequency with which each score occurs. See pages 71 & 72 for help. S = Efxz _ (Efx) 2 S = N N - 1
Step by Step Solution
There are 3 Steps involved in it

Get step-by-step solutions from verified subject matter experts