

Question: Show your work in complete (formulas, application and explanation). You can use excel, produce tables and then put them on the word document Problem 1;
Show your work in complete (formulas, application and explanation). You can use excel, produce tables and then put them on the word document
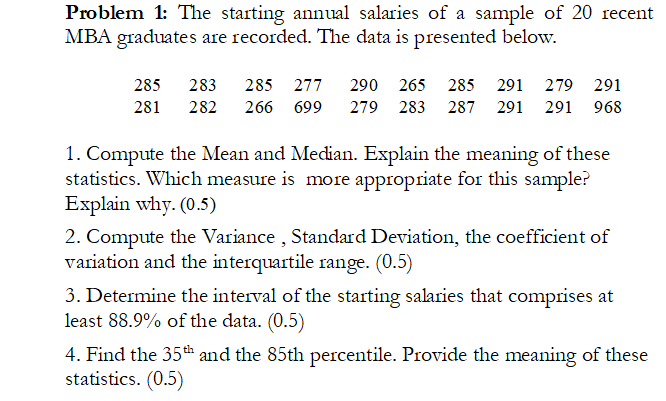
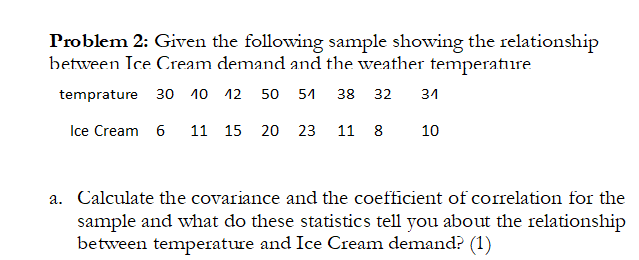
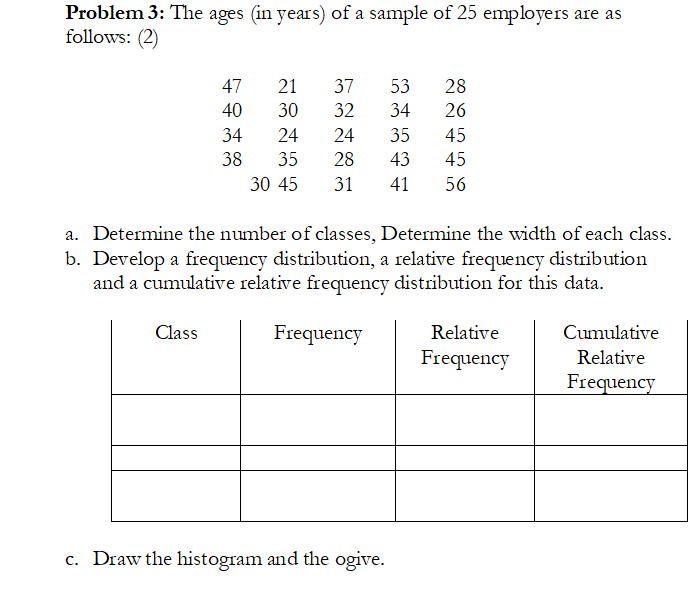
Problem 1; The starting annual salaries of a sample of 20 recent MB graduates are recorded. The data is presented below. 285 283 285 27'? 290 285 285 291 229 291 281 282 265 I599 279 283 287'r 291 291 EH58 1. Compute the Mean and Median. Explain the meaning of these statistics. W'hich measure is more appropriate for this sample? Explain why. (0.5) 2. Compute the Variance , Stande Deviation, the coefficient of variation and the interquartile range. {0.5) 3. Determine the interval of the starting salaries that comprises at least 88.9% of the data. {0.5} 4. Find the 35th and the 85th percentile. Provide the meaning of these statistics. {0.5} Problem 2: Given the following sample showing the relationship between Ice Cream demand and the weather temperature temprature 30 10 12 50 51 38 32 31 Ice Cream 6 11 15 20 23 11 8 10 a. Calculate the covariance and the coefficient of correlation for the sample and what do these statistics tell you about the relationship between temperature and Ice Cream demand? (1)Problem 3: The ages {in years) of a sample of 25 employers are as follows: {2) 4? 21 3? 53 28 4D 3D 32 34 26 34 24 24 35 45 33 35 23 43 45 3D 45 31 41 56 a. Determine the number of classes, Determine the width of each class. b. Develop a frequency distribution, a relative frequency distribution and a cumulative relative frequency distribution for this data. c. Draw the histogram and the ogive
Step by Step Solution
There are 3 Steps involved in it

Get step-by-step solutions from verified subject matter experts