

Question: Show your work. Include any code snippets you used to generate an answer, using comments in the code to clearly indicate which problem corresponds to
![12 9 5 10 11 1. [3 points] Without using networkx or](https://dsd5zvtm8ll6.cloudfront.net/si.experts.images/questions/2024/09/66f91a3395d78_20366f91a3338a5a.jpg)

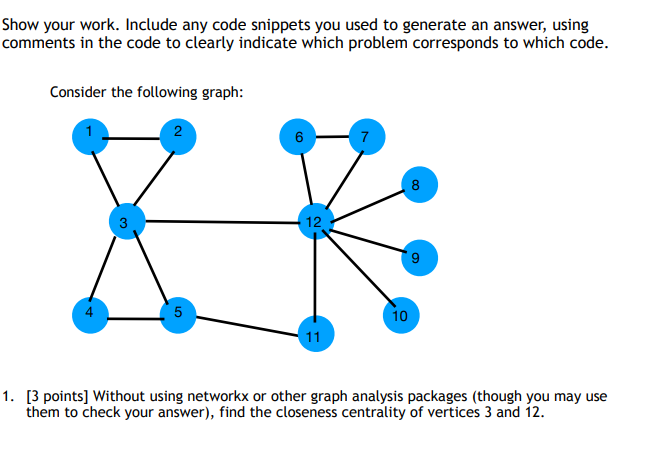
Show your work. Include any code snippets you used to generate an answer, using comments in the code to clearly indicate which problem corresponds to which code. Consider the following graph: 2 7 8 3 12 9 5 10 11 1. [3 points] Without using networkx or other graph analysis packages (though you may use them to check your answer), find the closeness centrality of vertices 3 and 12. 2. [3 points] Without using networkx or other graph analysis packages (though you may use them to check your answer), find the eccentricity of vertices 3, 12, and 11. 3. [3 points) Find the betweenness centrality of vertices 3 and 12. You may use networkx or other graph analysis packages, but include the code used to generate your answer in your submission (either as code in D2L, or as code snippets pasted into the document turned into Gradescope). 4. [3 points] Using networkx, find the prestige/eigenvector centrality of vertices 3 and 12. Include the code used to generate the answer. 5. [3 points) Find up, the average length of the shortest path between two vertices in this graph. 6. [3 points] Use Python to create a plot of the degree distribution of this graph. Include the code used to generate the plot as well as the plot in your submission. 7. [3 points] Without using networkx or other graph analysis packages (though you may use them to check your answer), find the clustering coefficient of vertex 3. 8. [3 points] Without using networkx or other graph analysis packages (though you may use them to check your answer), find the clustering coefficient of the graph. 9. [3 points] Use networkx to create an (undirected) Erdos-Renyi random graph with parameters n=200 and p=0.1. Create a visualization of the graph, with vertex sizes dependent on betweenness centrality (the higher the betweenness centrality, the greater the size) and node color dependent on degree. Include both the code to generate the plots, as well as the plots themselves, in your submission. Show your work. Include any code snippets you used to generate an answer, using comments in the code to clearly indicate which problem corresponds to which code. Consider the following graph: 2 7 8 3 12 9 5 10 11 1. [3 points] Without using networkx or other graph analysis packages (though you may use them to check your answer), find the closeness centrality of vertices 3 and 12. 2. [3 points] Without using networkx or other graph analysis packages (though you may use them to check your answer), find the eccentricity of vertices 3, 12, and 11. 3. [3 points) Find the betweenness centrality of vertices 3 and 12. You may use networkx or other graph analysis packages, but include the code used to generate your answer in your submission (either as code in D2L, or as code snippets pasted into the document turned into Gradescope). 4. [3 points] Using networkx, find the prestige/eigenvector centrality of vertices 3 and 12. Include the code used to generate the answer. 5. [3 points) Find up, the average length of the shortest path between two vertices in this graph. 6. [3 points] Use Python to create a plot of the degree distribution of this graph. Include the code used to generate the plot as well as the plot in your submission. 7. [3 points] Without using networkx or other graph analysis packages (though you may use them to check your answer), find the clustering coefficient of vertex 3. 8. [3 points] Without using networkx or other graph analysis packages (though you may use them to check your answer), find the clustering coefficient of the graph. 9. [3 points] Use networkx to create an (undirected) Erdos-Renyi random graph with parameters n=200 and p=0.1. Create a visualization of the graph, with vertex sizes dependent on betweenness centrality (the higher the betweenness centrality, the greater the size) and node color dependent on degree. Include both the code to generate the plots, as well as the plots themselves, in your submission
Step by Step Solution
There are 3 Steps involved in it

Get step-by-step solutions from verified subject matter experts