

Question: showing inputs, outputs, and steps in the process. 2 . A scheduling tool that lists project Critical Path tasks, with bars indicating start and end
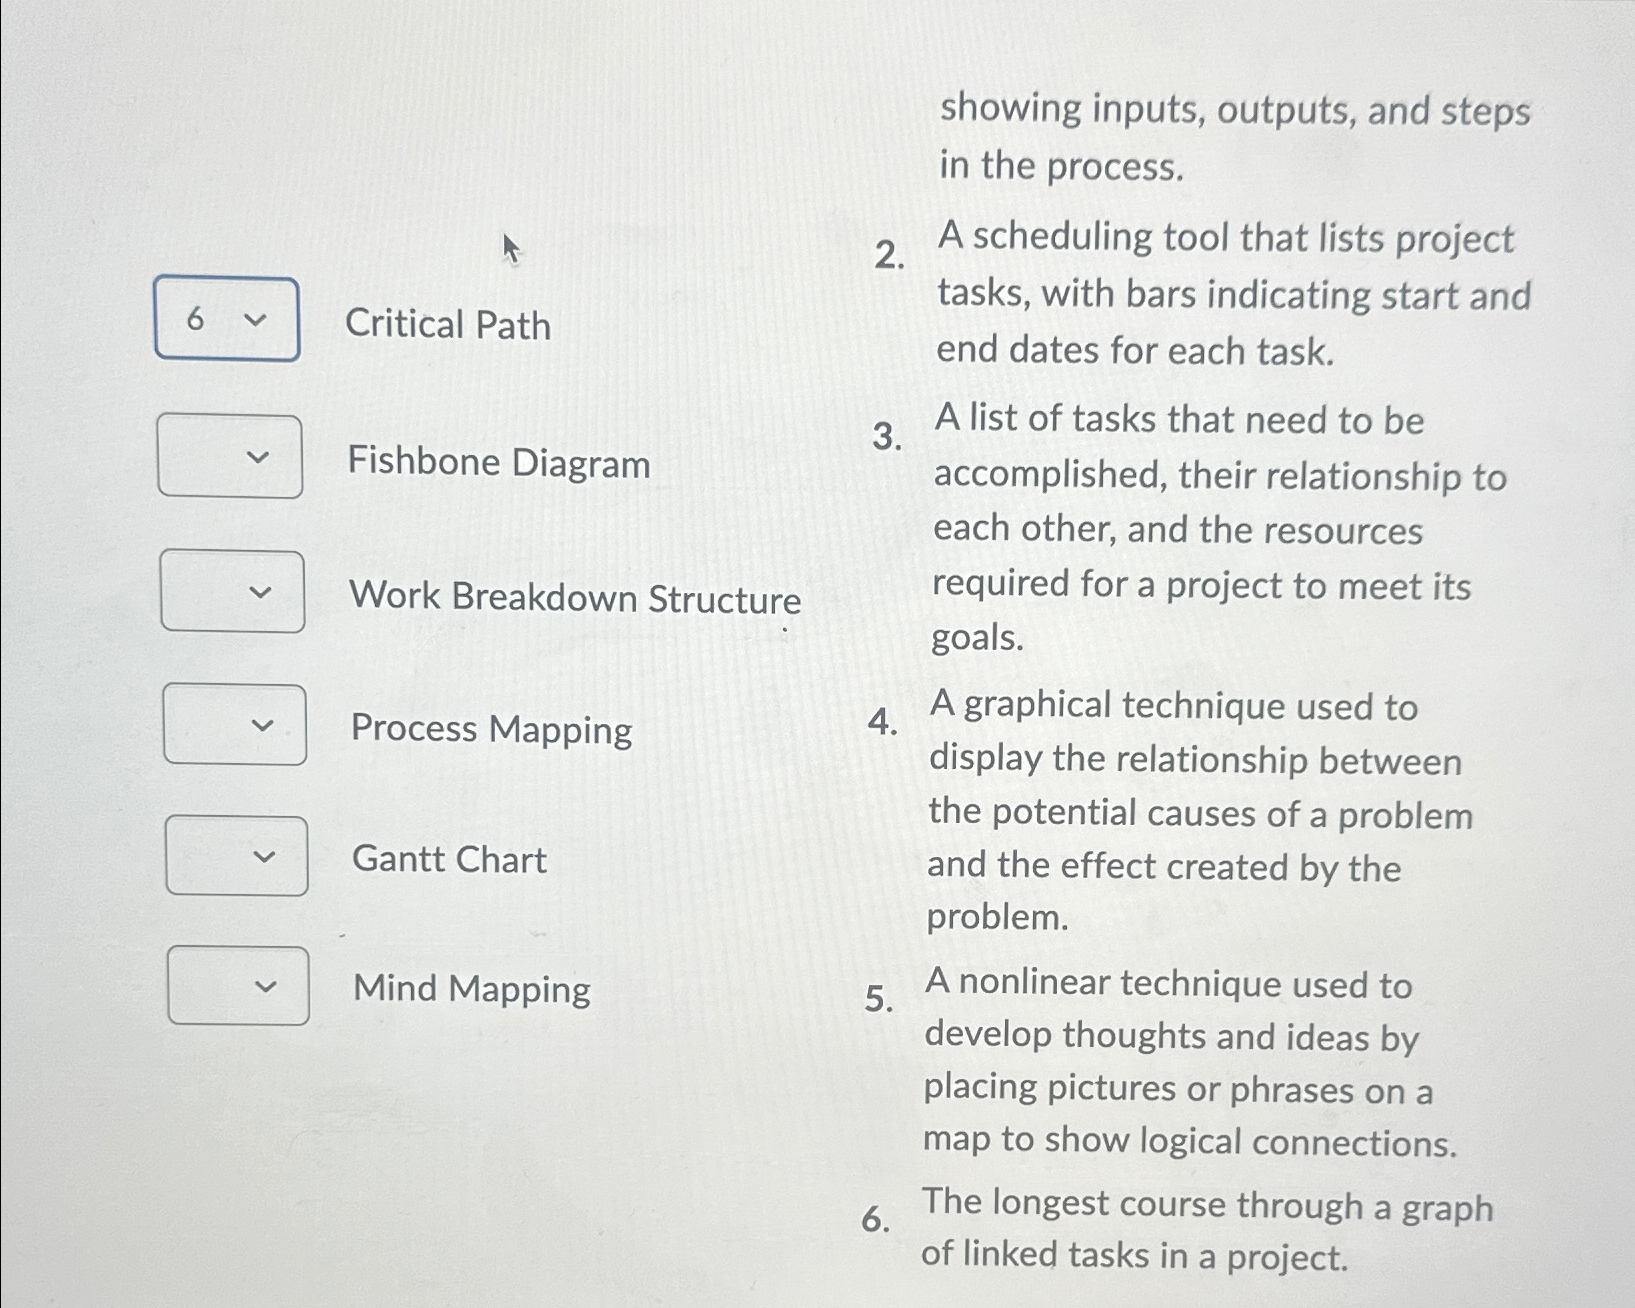
showing inputs, outputs, and steps in the process.
A scheduling tool that lists project
Critical Path tasks, with bars indicating start and end dates for each task.
Fishbone Diagram
Work Breakdown Structure
Process Mapping
Gantt Chart
Mind Mapping
A list of tasks that need to be accomplished, their relationship to each other, and the resources required for a project to meet its goals.
A graphical technique used to display the relationship between the potential causes of a problem and the effect created by the problem.
A nonlinear technique used to develop thoughts and ideas by placing pictures or phrases on a map to show logical connections.
The longest course through a graph of linked tasks in a project.
Step by Step Solution
There are 3 Steps involved in it
1 Expert Approved Answer
Step: 1 Unlock

Question Has Been Solved by an Expert!
Get step-by-step solutions from verified subject matter experts
Step: 2 Unlock
Step: 3 Unlock