

Question: Shown below is a portion of a computer output for a linear regression analysis relating the sales of a company (y in millions of dollars)
Shown below is a portion of a computer output for a linear regression analysis relating the sales of a company (y in millions of dollars) to advertising expenditures (x1 in millions of dollars) and the number of salespeople (x2).
a.Completethe missing values with (?) in the regression output tables above.
b.Writethe estimated linear regression equation relating sales to advertising expenditure and number of salespeople.
c.Fullyinterpretthe meaning of the estimated coefficient of ??1 in this estimated linear regression equation.
d.Calculatethe coefficient of determination, R2, and fully interpret its meaning in this context. Be very specific.
e.Use the estimated linear regression equation topredictsales (in dollars) when advertising expenditure = $4m and there are 10 salespeople.
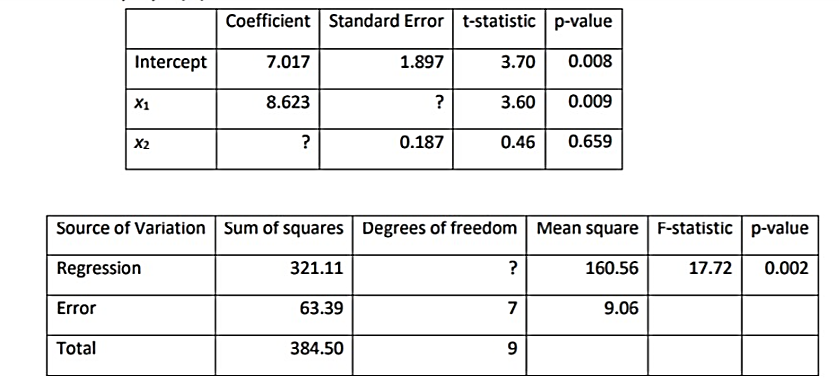
Coefficient Standard Error t-statistic p-value Intercept 7.017 1.897 3.70 0.008 X1 8.623 3.60 0.009 X2 0.187 0.46 0.659 Source of Variation Sum of squares Degrees of freedom Mean square F-statistic p-value Regression 321.11 160.56 17.72 0.002 Error 63.39 7 9.06 Total 384.50 9
Step by Step Solution
There are 3 Steps involved in it

Get step-by-step solutions from verified subject matter experts