

Question: Shown below is a portion of an Excel output for regression analysis relating Y (dependent variable) and X (independent variable). If the variable X has
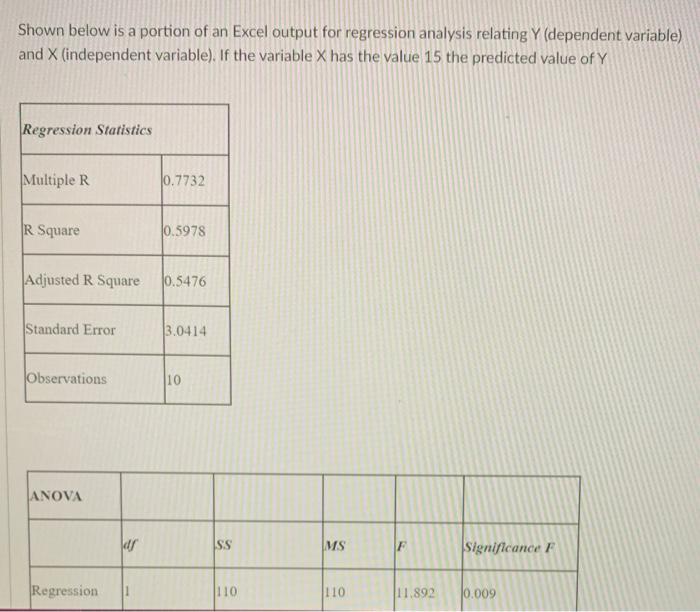
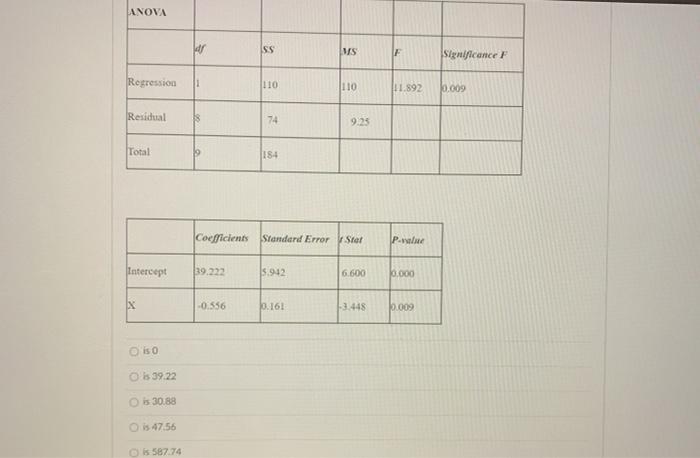
Shown below is a portion of an Excel output for regression analysis relating Y (dependent variable) and X (independent variable). If the variable X has the value 15 the predicted value of Y Regression Statistics Multiple R 10.7732 R Square 0.5978 Adjusted R Square 10.5476 Standard Error 3.0414 Observations 10 ANOVA SS WS F Significance F Regression 110 110 11.892 0.009 ANOVA dr SS MS E Significance Regression 1 110 110 11.892 0.009 Residual 74 9.25 Total 184 Coefficients Standard Error Stor Pwe Intercept 39.222 5.9442 6.600 0.000 X -0.556 0.16 3.448 2009 o iso 39.22 is 30.88 is 47.56 OS 587.74
Step by Step Solution
There are 3 Steps involved in it
1 Expert Approved Answer
Step: 1 Unlock

Question Has Been Solved by an Expert!
Get step-by-step solutions from verified subject matter experts
Step: 2 Unlock
Step: 3 Unlock