

Question: Shown below is a set of data from a sample of n = 11 items. Complete parts (a) and (b). X 6 10 16 8
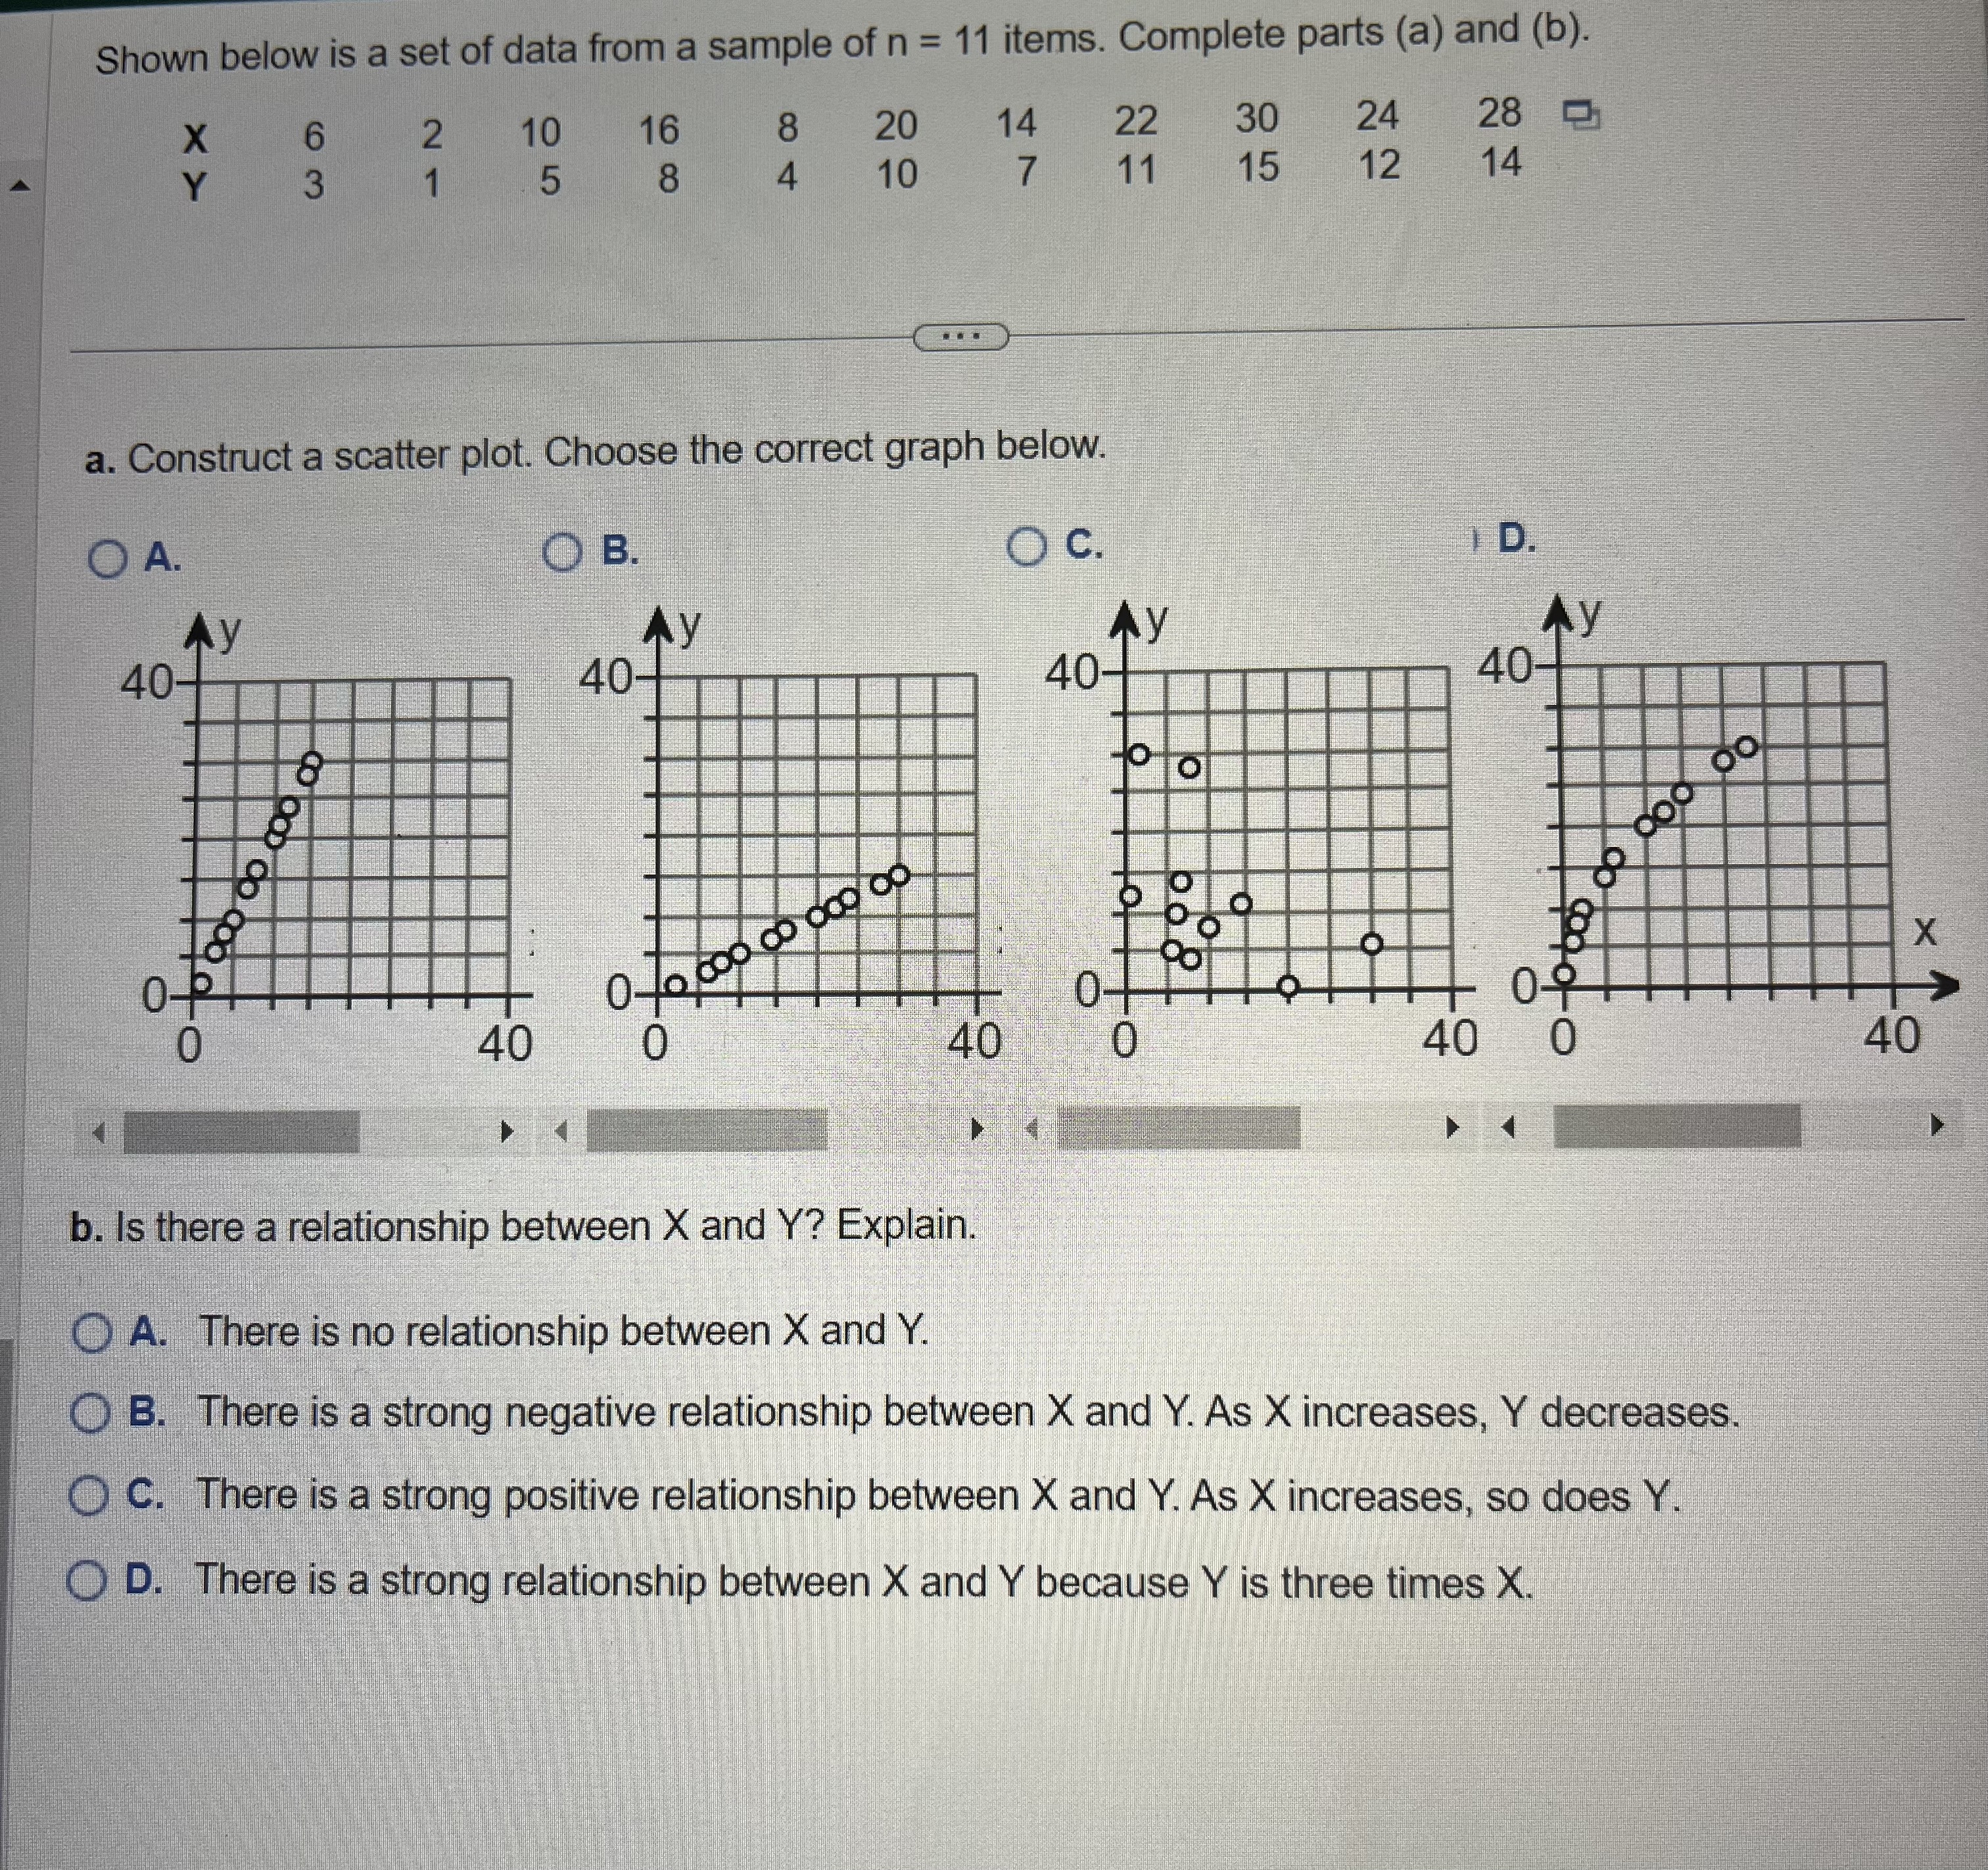
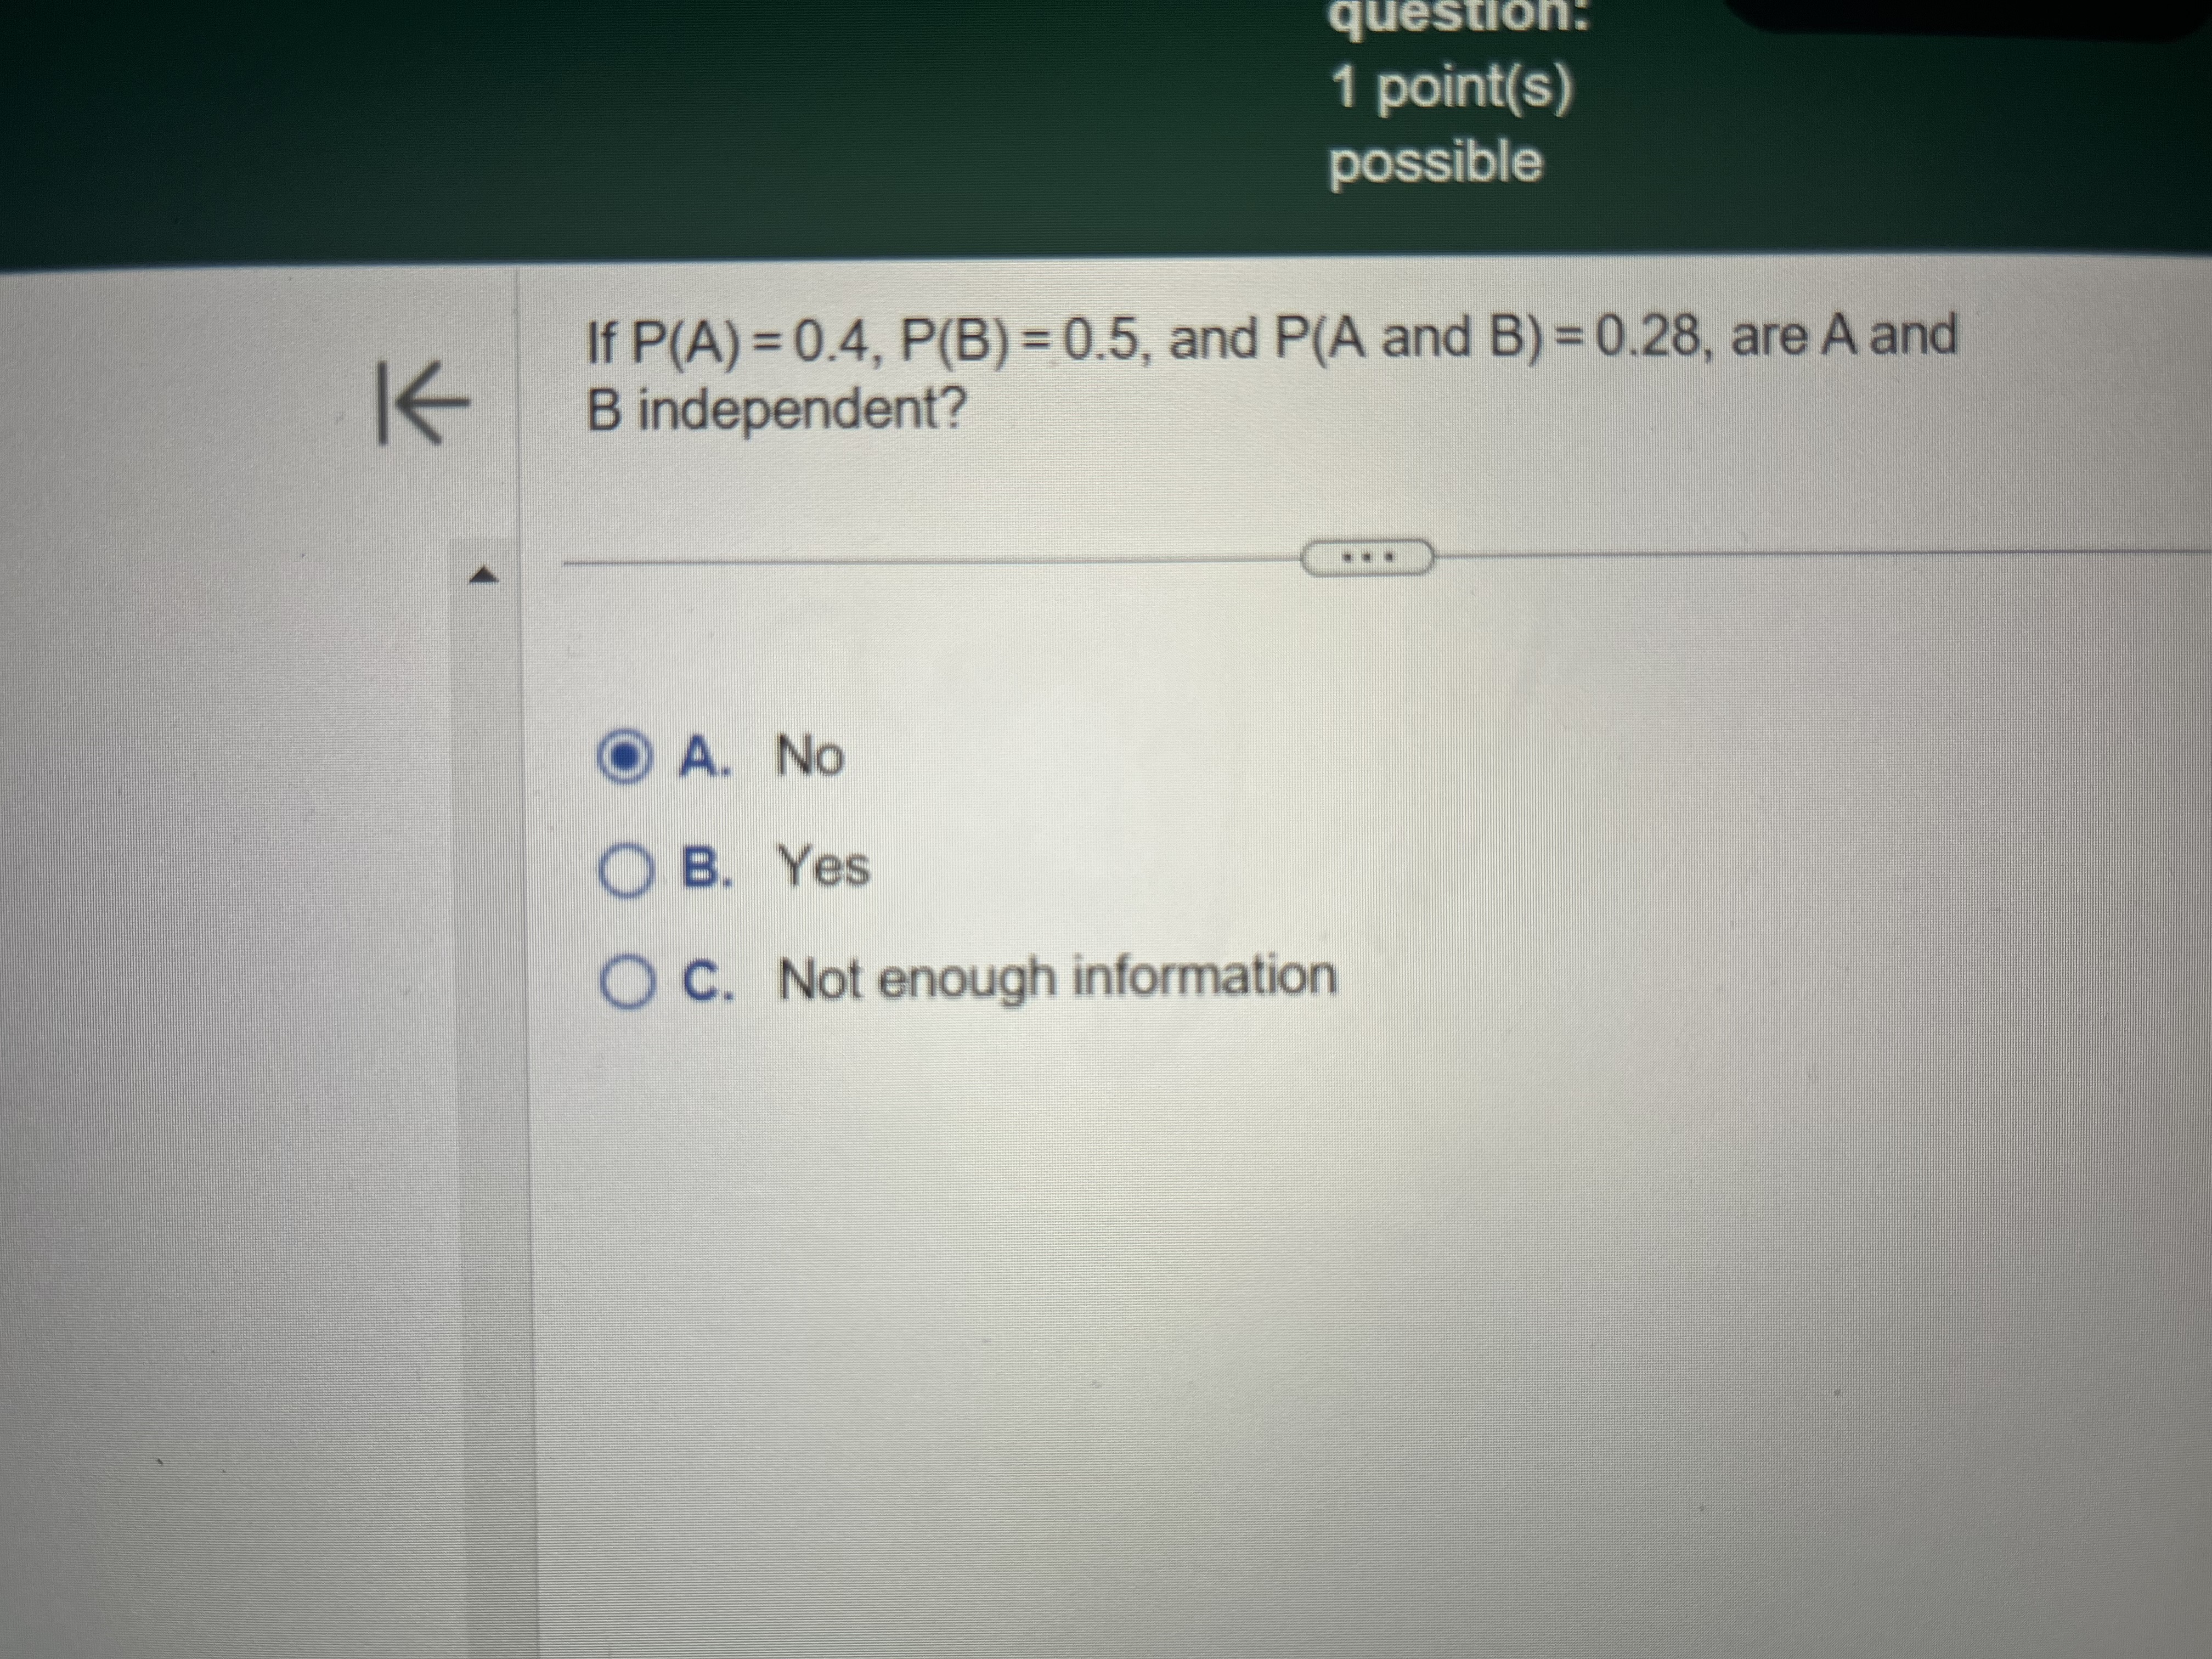
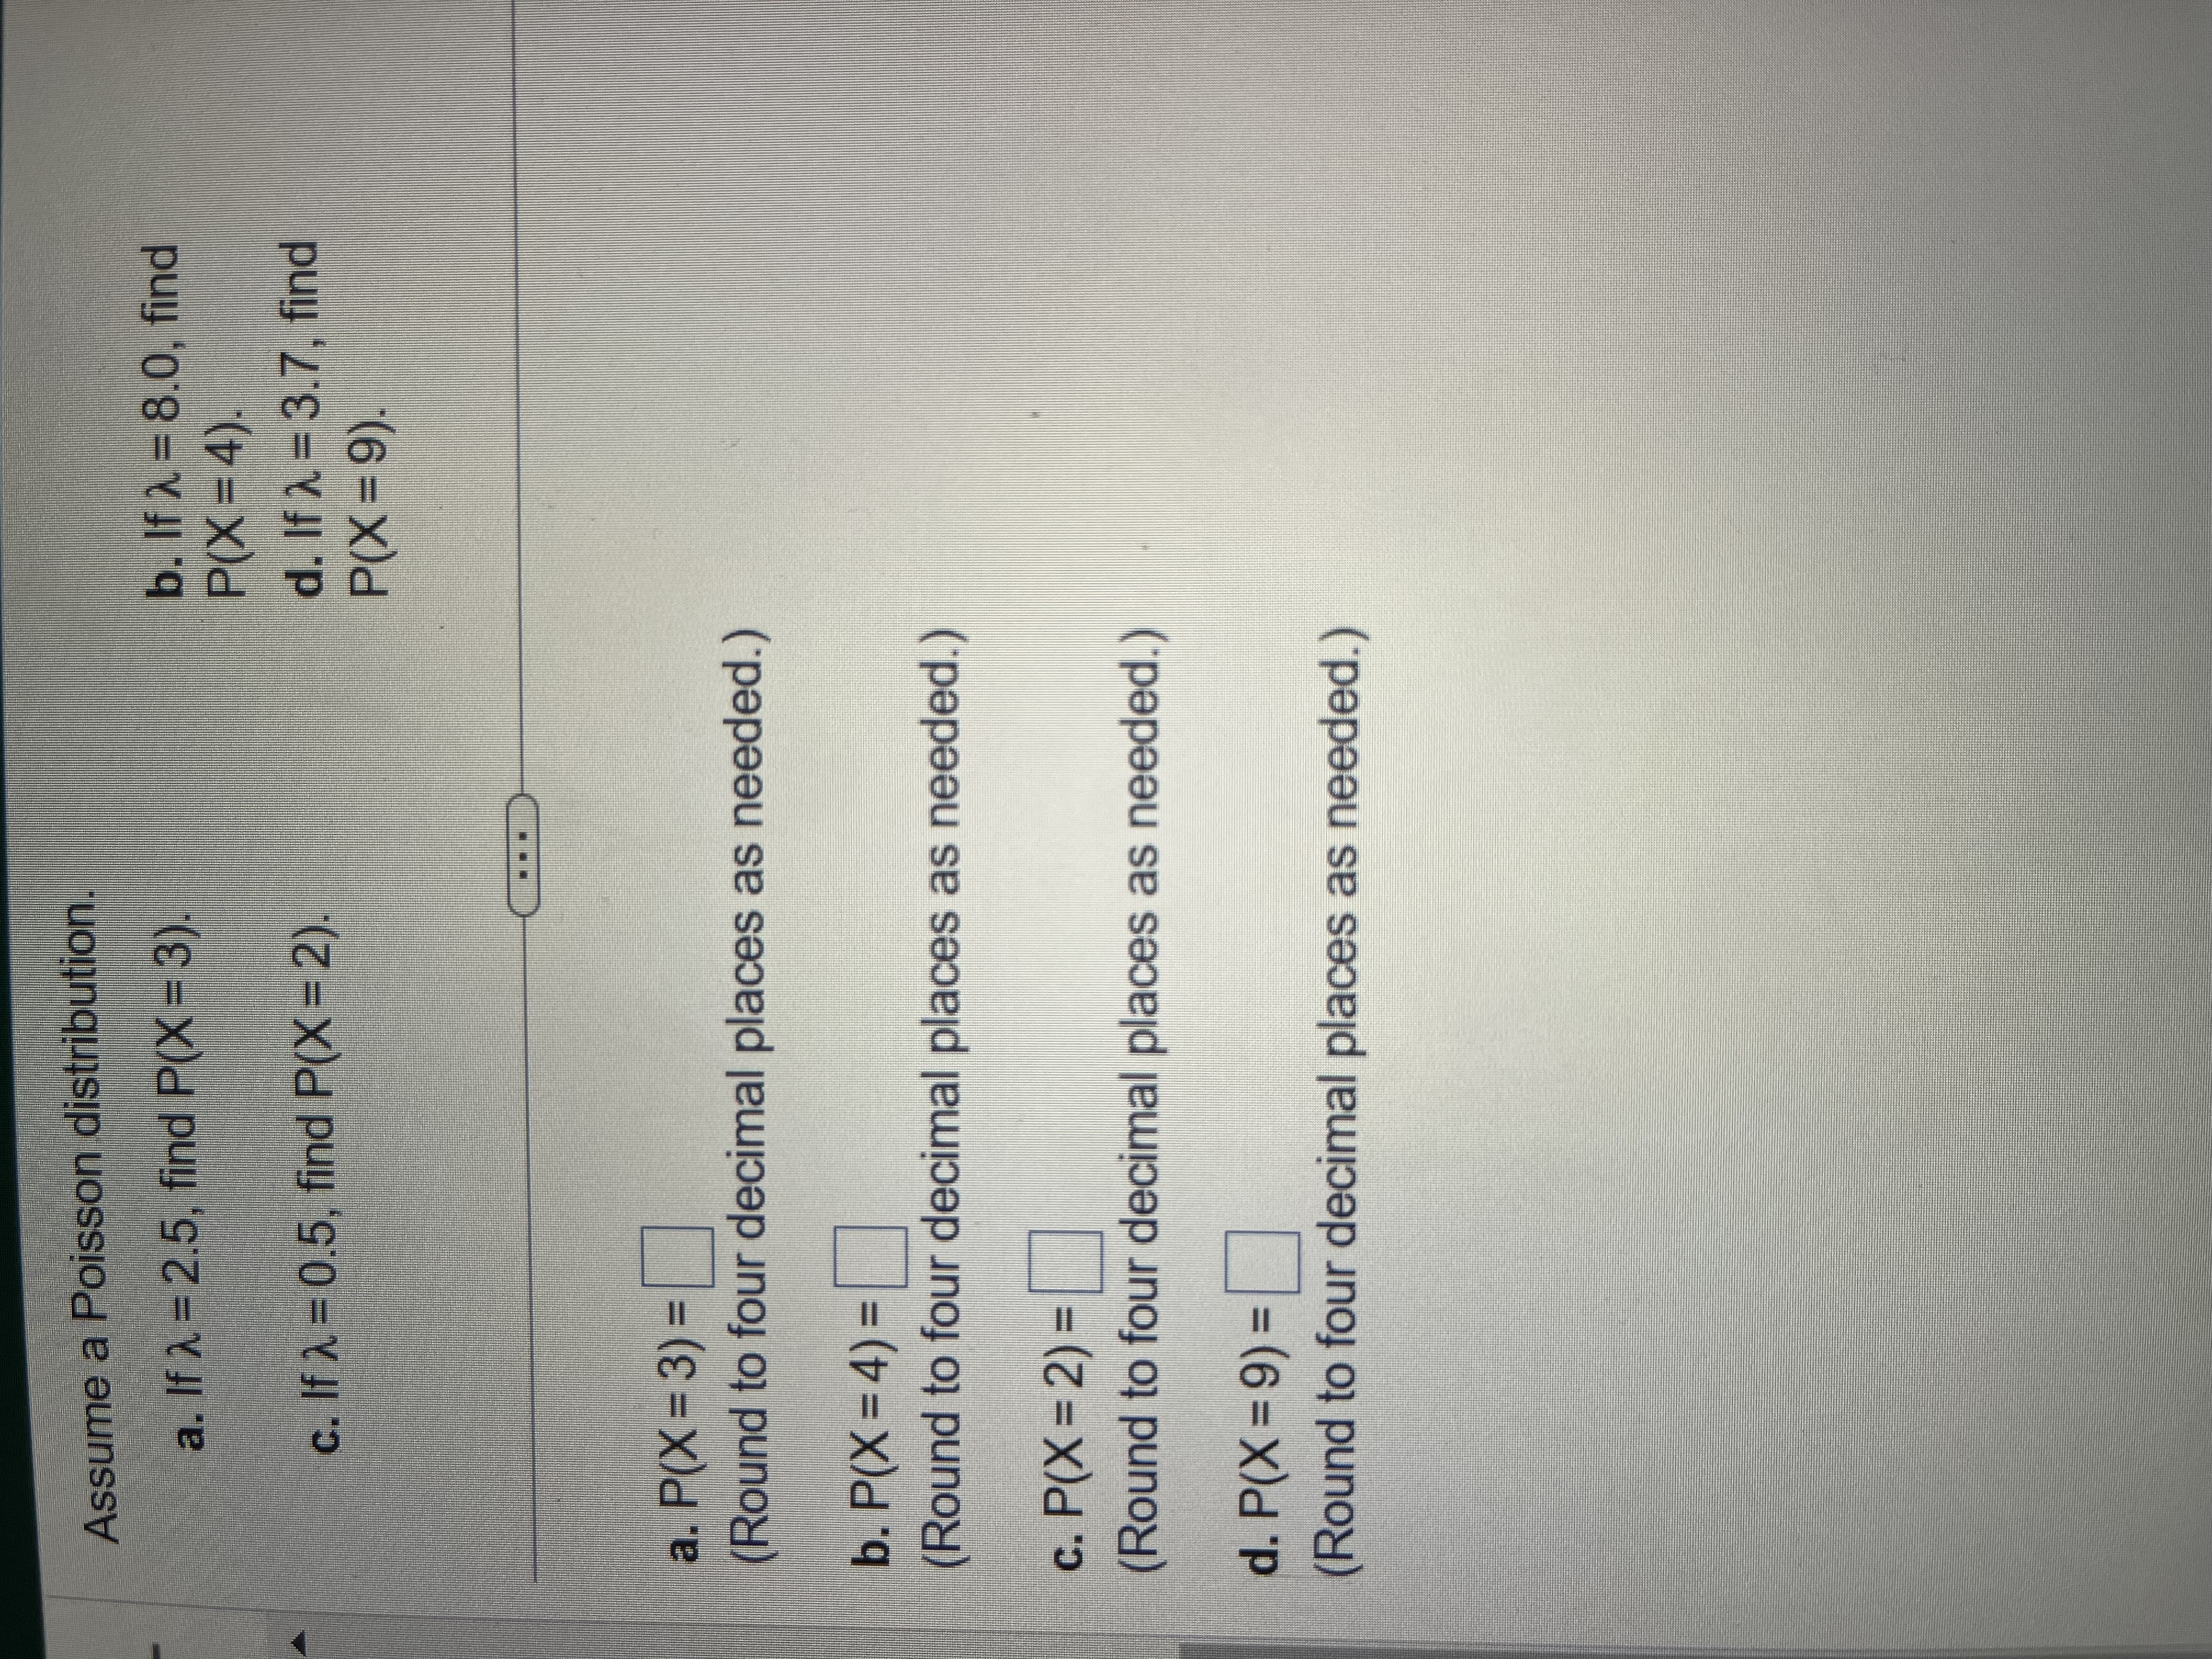
Shown below is a set of data from a sample of n = 11 items. Complete parts (a) and (b). X 6 10 16 8 20 14 22 30 24 28 3 1 5 8 4 10 7 11 15 12 14 a. Construct a scatter plot. Choose the correct graph below. O A. O B. O c. I D. 40 7 40- 40 1y 40JY + tot it 0 10 Coo co 0oo oo pot X 40 O - 40 40 b. Is there a relationship between X and Y? Explain. O A. There is no relationship between X and Y. O B. There is a strong negative relationship between X and Y. As X increases, Y decreases. O C. There is a strong positive relationship between X and Y. As X increases, so does Y. O D. There is a strong relationship between X and Y because Y is three times X.question. 1 point(s) possible K If P(A) = 0.4, P(B) = 0.5, and P(A and B) = 0.28, are A and B independent? - .. O A. NO O B. Yes O C. Not enough informationAssume a Poisson distribution a. If 2 = 2.5, find P(X = 3). b. If 2 = 8.0, find P(X = 4). c. If ) = 0.5, find P(X = 2). d. If 2 =3.7, find P(X = 9). a. P(X = 3) = (Round to four decimal places as needed.) b. P(X = 4) = (Round to four decimal places as needed. ) c. P(X = 2) = (Round to four decimal places as needed.) d. P(X = 9) = (Round to four decimal places as needed.)
Step by Step Solution
There are 3 Steps involved in it

Get step-by-step solutions from verified subject matter experts