

Question: Shown in the figure below is a simulated stability graph of a protein with melting temperature (T m ) of 75 C and DH m
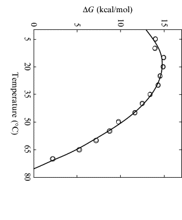
Shown in the figure below is a simulated stability graph of a protein with melting temperature (Tm) of 75 C and DHm of 180 kcal/mol, comment on the changes in the free energy of this protein and what temperature do you believe is its most stable form?
Step by Step Solution
There are 3 Steps involved in it
1 Expert Approved Answer
Step: 1 Unlock

Question Has Been Solved by an Expert!
Get step-by-step solutions from verified subject matter experts
Step: 2 Unlock
Step: 3 Unlock