

Question: Shown in the figure is spectrum plot for the periodic signal x (t). AOOn ~100n 10Ont AOOn Determine the period To of x (t).
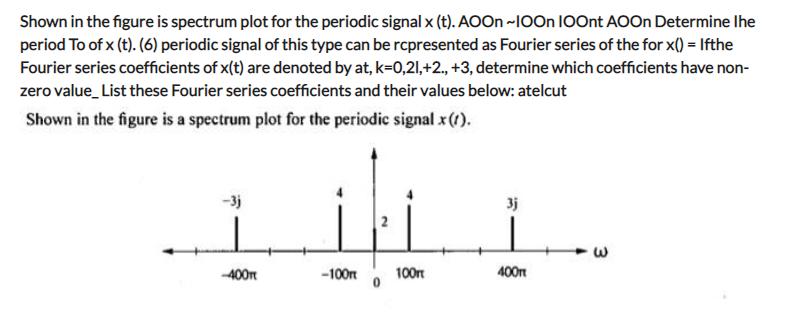
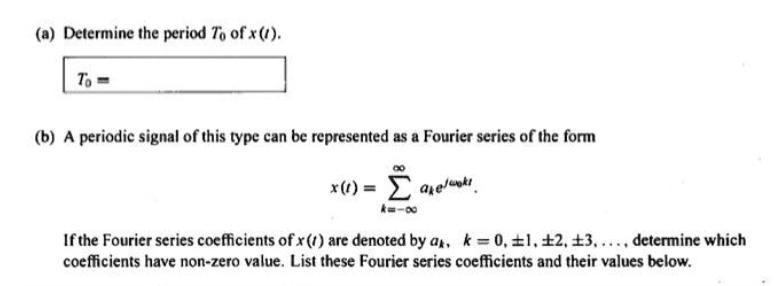
Shown in the figure is spectrum plot for the periodic signal x (t). AOOn ~100n 10Ont AOOn Determine the period To of x (t). (6) periodic signal of this type can be rcpresented as Fourier series of the for x() = Ifthe Fourier series coefficients of x(t) are denoted by at, k=0,21,+2., +3, determine which coefficients have non- zero value_List these Fourier series coefficients and their values below: atelcut Shown in the figure is a spectrum plot for the periodic signal x (1). -3j -400m ili i 2 100m 400m -100m W (a) Determine the period To of x (1). To (b) A periodic signal of this type can be represented as a Fourier series of the form x(t) = ahelwaki If the Fourier series coefficients of x (1) are denoted by a. k=0, 11, 12, 13,..., determine which coefficients have non-zero value. List these Fourier series coefficients and their values below.
Step by Step Solution
3.40 Rating (150 Votes )
There are 3 Steps involved in it

Get step-by-step solutions from verified subject matter experts