

Question: shows the answer and steps by step Question 1: a) Ten samples of size 8 were taken for a machine as shown below: Find control
shows the answer and steps by step
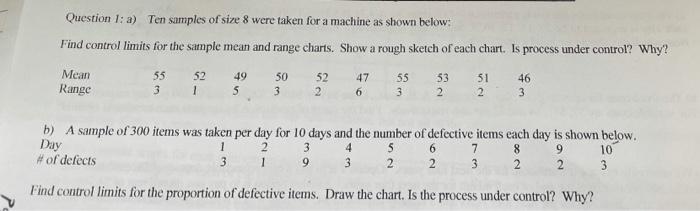
Question 1: a) Ten samples of size 8 were taken for a machine as shown below: Find control limits for the sample mean and range charts. Show a rough sketch of each chart. Is process under control? Why? Mean Range 52 55 3 52 1 49 5 50 3 47 6 55 3 53 2 51 2 46 3 b) A sample of 300 items was taken per day for 10 days and the number of defective items each day is shown below. Day 2 3 4 5 6 7 8 9 10 # of defects 3 1 9 3 2 2 3 2 2 3 1 Find control limits for the proportion of defective items. Draw the chart. Is the process under control? Why
Step by Step Solution
There are 3 Steps involved in it
1 Expert Approved Answer
Step: 1 Unlock

Question Has Been Solved by an Expert!
Get step-by-step solutions from verified subject matter experts
Step: 2 Unlock
Step: 3 Unlock