

Question: sics and x > Unit1_Activity_The Importance. X Unit_1 Activity_The Importance x + web.kamihq.com/web/viewer.html?source=filepicker&document_identifier=1aac40ff-d4a9-45d6-ab27-edbfd799 e O e Unit_1_Activity_Lab_Safety.pdf Make a circle graph with this data. 1
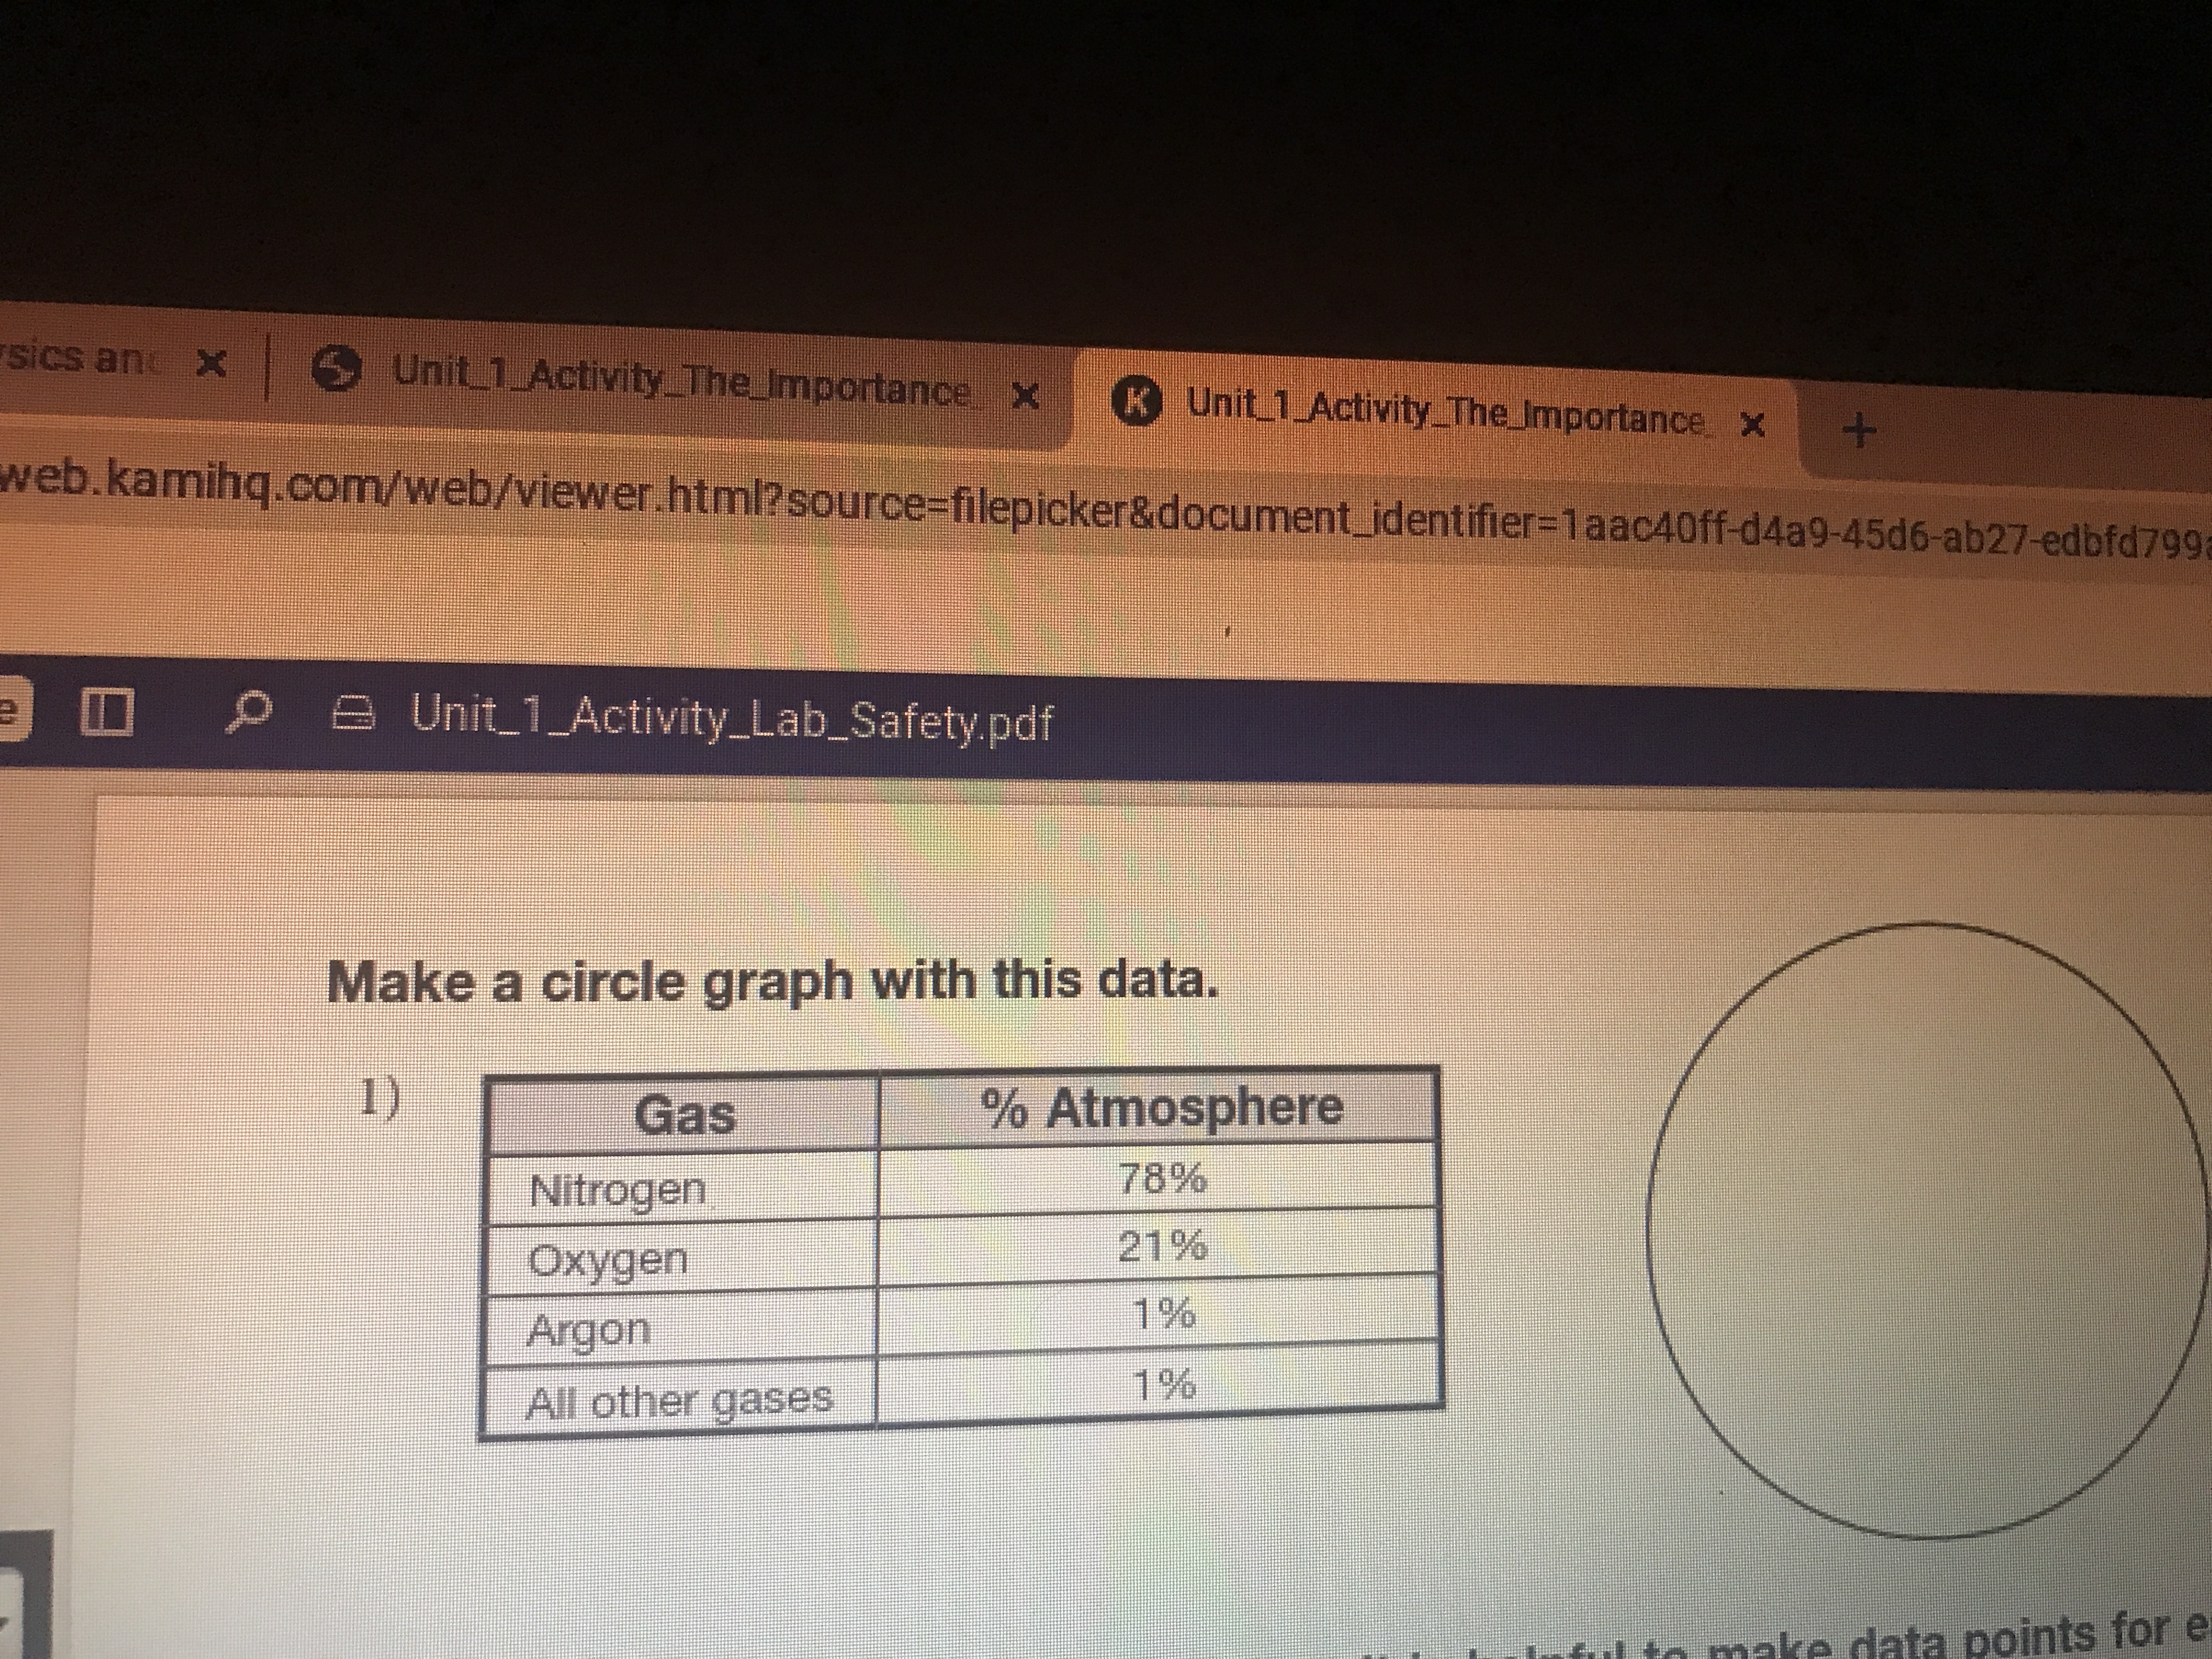
sics and x > Unit1_Activity_The Importance. X Unit_1 Activity_The Importance x + web.kamihq.com/web/viewer.html?source=filepicker&document_identifier=1aac40ff-d4a9-45d6-ab27-edbfd799 e O e Unit_1_Activity_Lab_Safety.pdf Make a circle graph with this data. 1 ) Gas % Atmosphere Nitrogen 78% Oxygen 21% Argon 1% All other gases 1% ra data points for e
Step by Step Solution
There are 3 Steps involved in it
1 Expert Approved Answer
Step: 1 Unlock

Question Has Been Solved by an Expert!
Get step-by-step solutions from verified subject matter experts
Step: 2 Unlock
Step: 3 Unlock