

Question: sies and legend. Problem One: (Depicted from Problem 3.4, Chapra textbook) The average daily temperature for an area can be approximated by the following function:
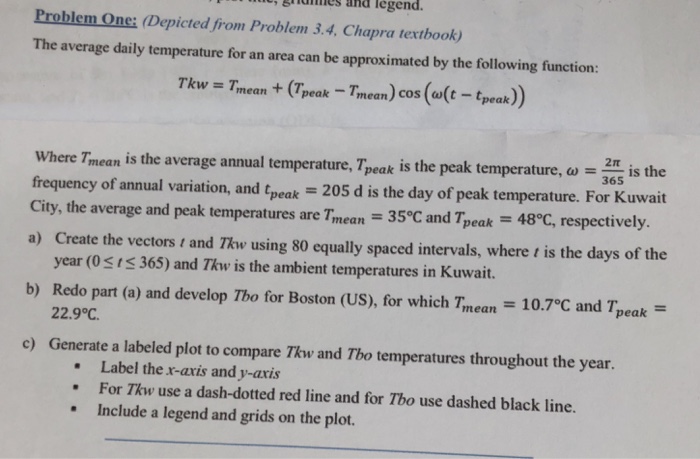
sies and legend. Problem One: (Depicted from Problem 3.4, Chapra textbook) The average daily temperature for an area can be approximated by the following function: Tkw = T,nemt (Tpeak-mean) cos ((t-tpeak)) 2 where T mean is the average annual temperature, Tpeak is the peak temperature, -365 is the frequency of annual variation, and tpeak 205 d is the day of peak temperature. For Kuwait City, the average and peak tempertures are T,nean = 35C and Tpeak-48C, respectively. a) Create the vectors t and The using 80 equally spaced intervals, where t is the days of the year (0SIS 365) and Tkw is the ambient temperatures in Kuwait. Redo part (a) and develop Tho for Boston (US), for which Tmean-10.7C and Teak 22.9 b) c) Generate a labeled plot to compare Tkw and Tho temperatures throughout the year. . Label the x-axis and y-axis For Tkw use a dash-dotted red line and for Tho use dashed black line. Include a legend and grids on the plot
Step by Step Solution
There are 3 Steps involved in it

Get step-by-step solutions from verified subject matter experts