

Question: Simple Linear kegression It is common to have data that suggests a linear relationship but due to experimental or measurement errors the data points do
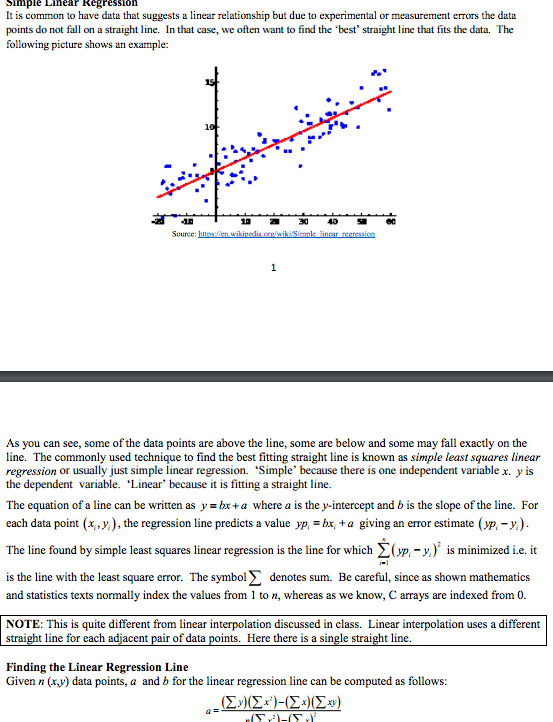
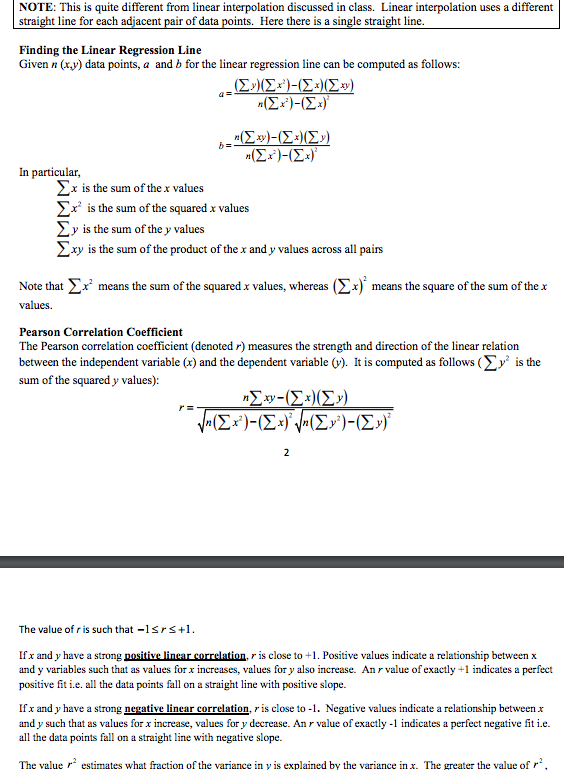
Simple Linear kegression It is common to have data that suggests a linear relationship but due to experimental or measurement errors the data points do not fall on a straight line. In that case, we often want to find the best' straight line that fits the data. The following picture shows an example: Source As you can see, some of the data points are above the line, some are below and some may fall exactly on the line. The commonly used technique to find the best fitting straight line is known as simple least squares linear regression or usually just simple linear regression. "Simple because there is one independent variable x yis the dependent variable. Linear" because it is fitting a straight line. The equation of a line can be written as y box +a where a is the y-intercept and b is the slope of the line. For each data point (x,y), the regression line predicts a value yp bu, a giving an error estimate (yp -y) The line found by simple least squares linear regression is the line for which ypa y is minimized i.e. it is the line with the least square error. The symbols denotes sum. Be careful, since as shown mathematics and statistics texts normally index the values from 1 to n, whereas as we know, Carrays are indexed from 0. NOTE: This is quite different from linear interpolation discussed in class. Linear interpolation uses a different t line for each adjacent pair of data points. Here there is a sin t line. stra e stra Finding the Linear Regression Line Given n (xy) data points, a and b for the linear regressio n line can be computed as follows Simple Linear kegression It is common to have data that suggests a linear relationship but due to experimental or measurement errors the data points do not fall on a straight line. In that case, we often want to find the best' straight line that fits the data. The following picture shows an example: Source As you can see, some of the data points are above the line, some are below and some may fall exactly on the line. The commonly used technique to find the best fitting straight line is known as simple least squares linear regression or usually just simple linear regression. "Simple because there is one independent variable x yis the dependent variable. Linear" because it is fitting a straight line. The equation of a line can be written as y box +a where a is the y-intercept and b is the slope of the line. For each data point (x,y), the regression line predicts a value yp bu, a giving an error estimate (yp -y) The line found by simple least squares linear regression is the line for which ypa y is minimized i.e. it is the line with the least square error. The symbols denotes sum. Be careful, since as shown mathematics and statistics texts normally index the values from 1 to n, whereas as we know, Carrays are indexed from 0. NOTE: This is quite different from linear interpolation discussed in class. Linear interpolation uses a different t line for each adjacent pair of data points. Here there is a sin t line. stra e stra Finding the Linear Regression Line Given n (xy) data points, a and b for the linear regressio n line can be computed as follows
Step by Step Solution
There are 3 Steps involved in it

Get step-by-step solutions from verified subject matter experts