

Question: - Simulation Decision #1 After reviewing all reading make a decision on improving the numbers for human captial. Click on the Decision tab (top right
- Simulation Decision #1
- After reviewing all reading make a decision on improving the numbers for human captial.
- Click on the "Decision" tab (top right of the navigation bar) and input data to make decisions for your hospital.
- Once all decisions are entered, click the button at the bottom to "send your decisions" for processing.
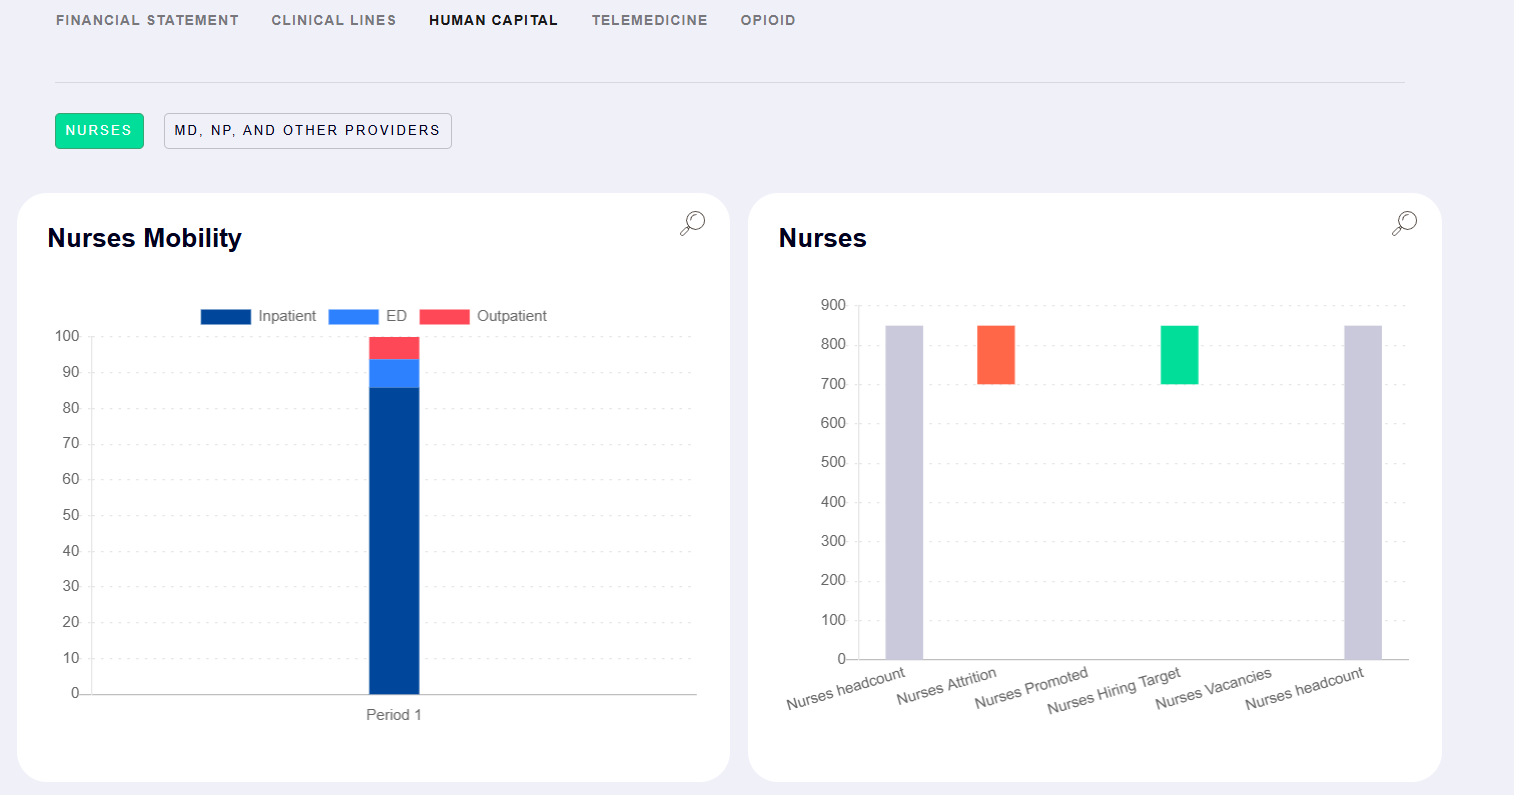
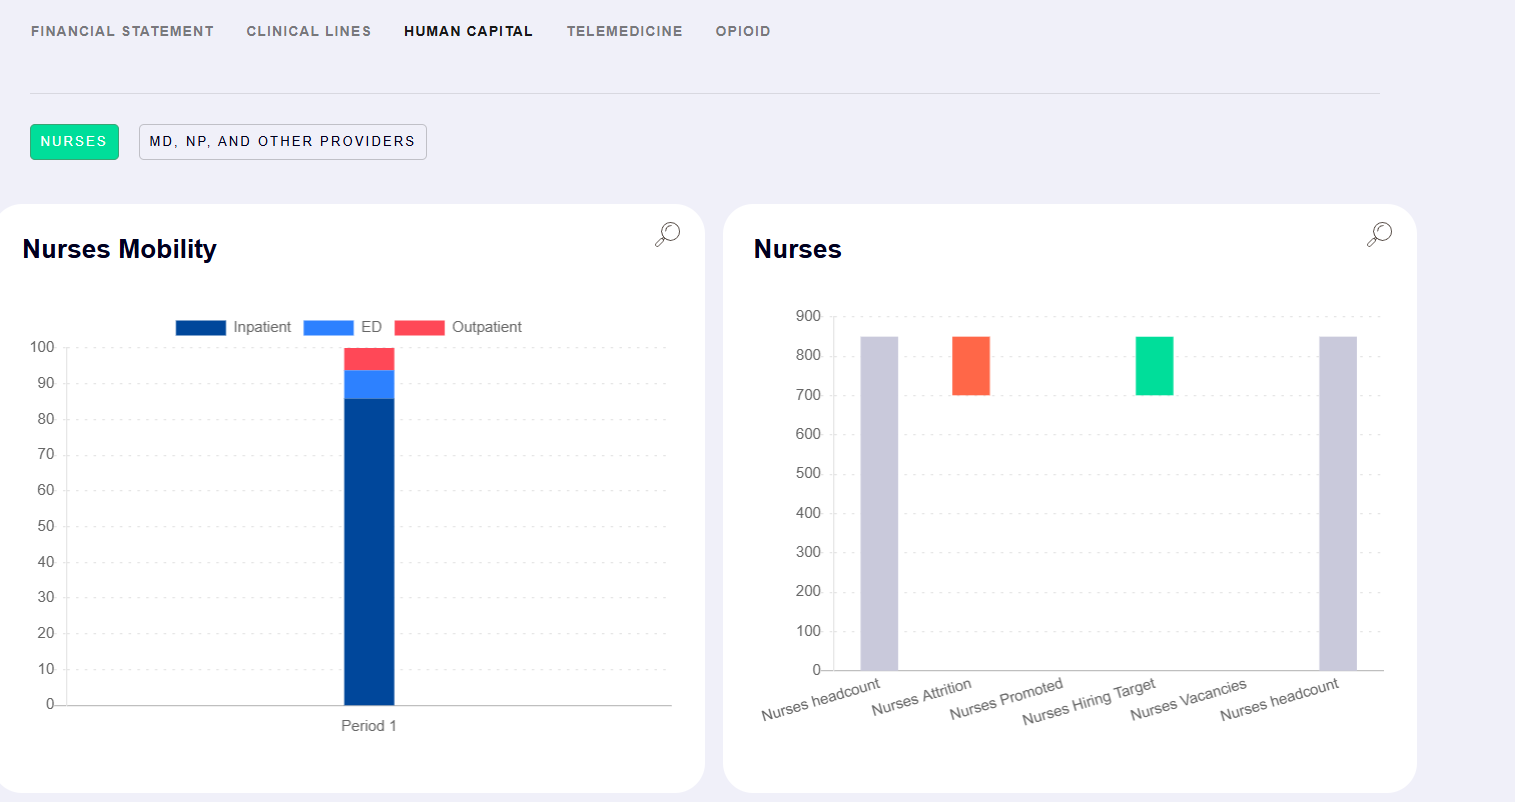
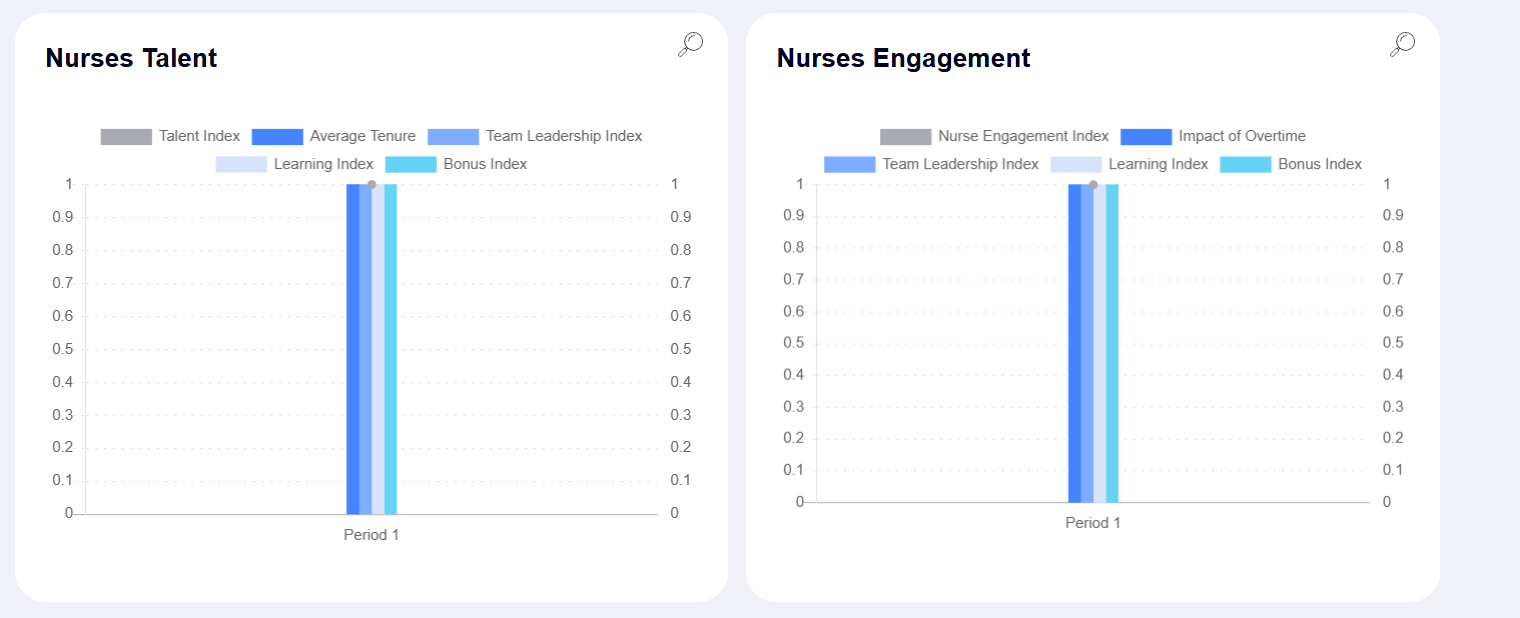
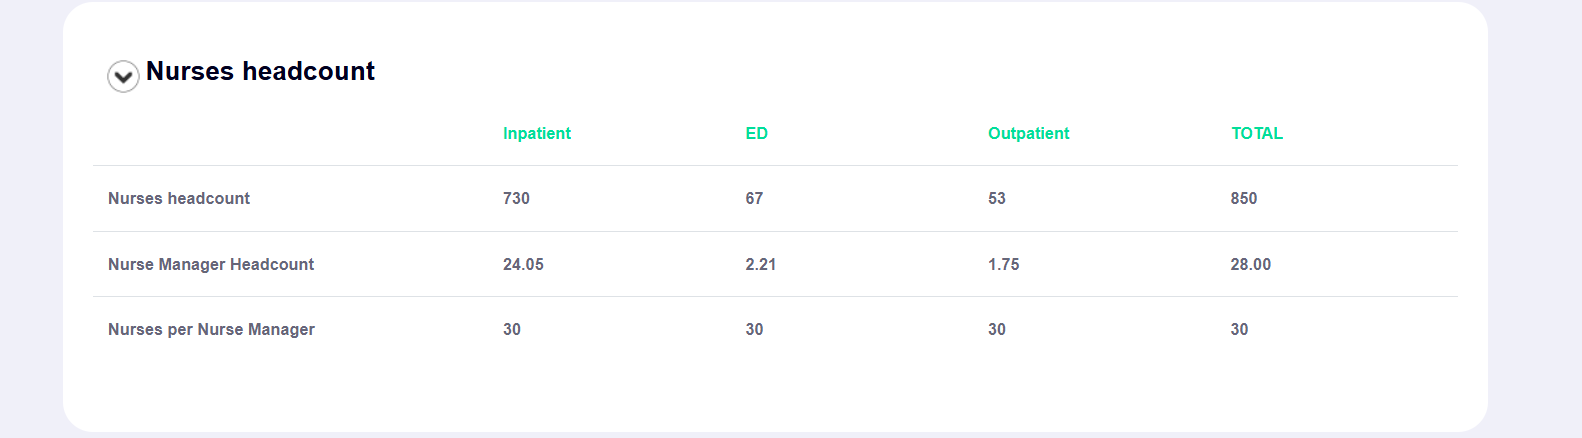
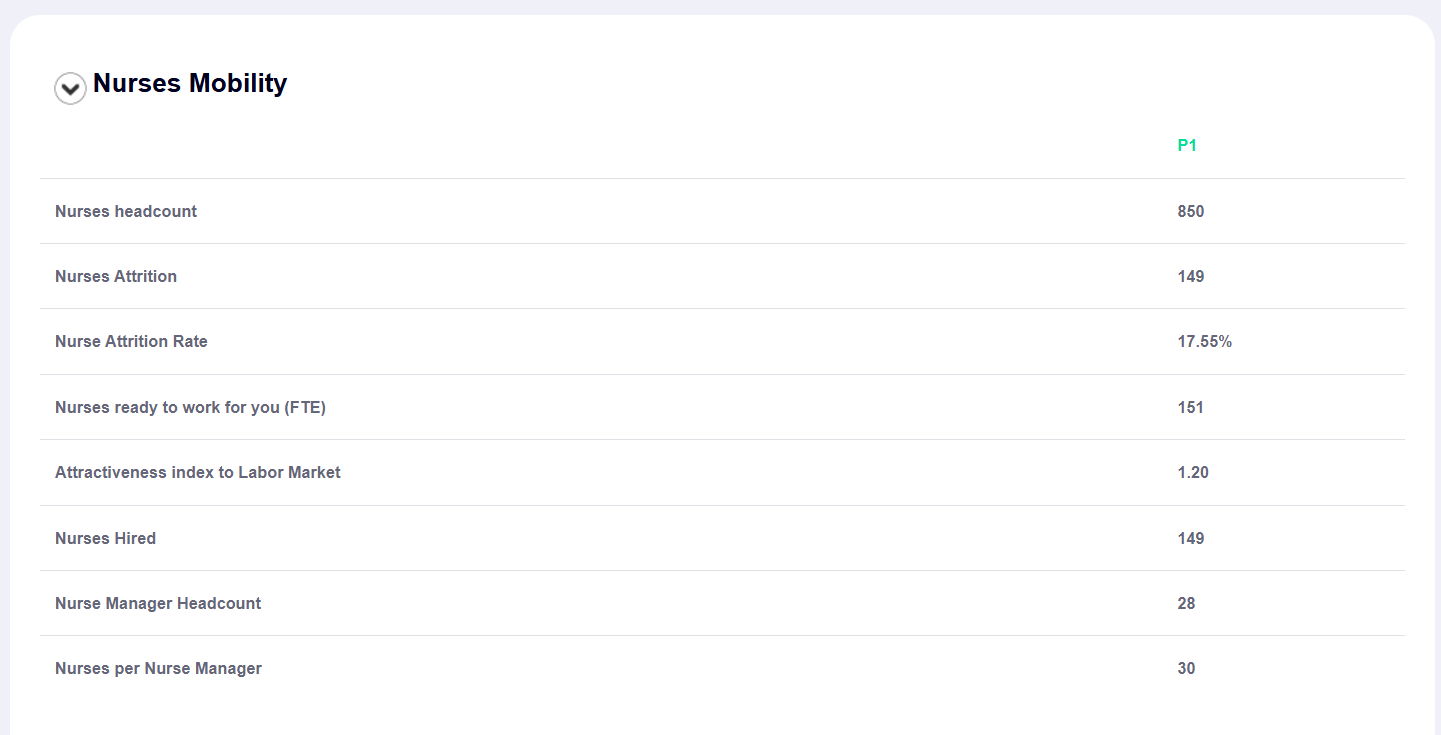
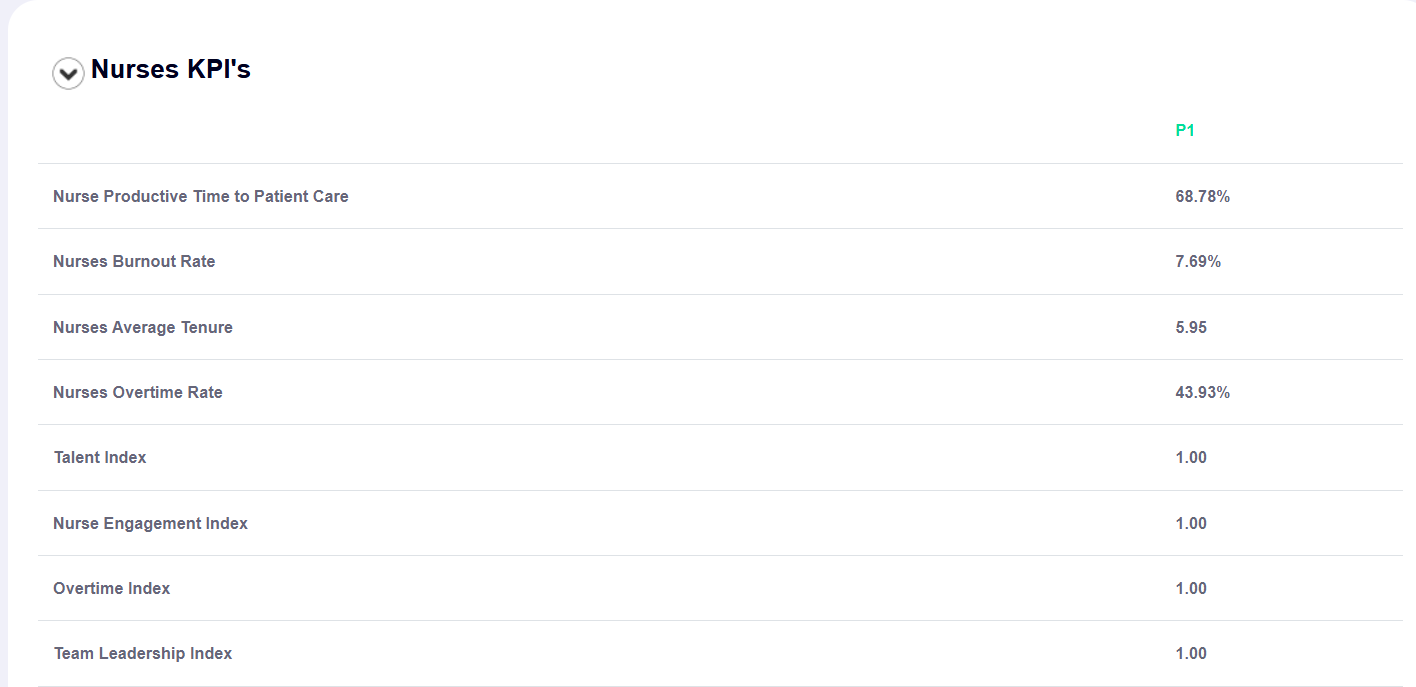
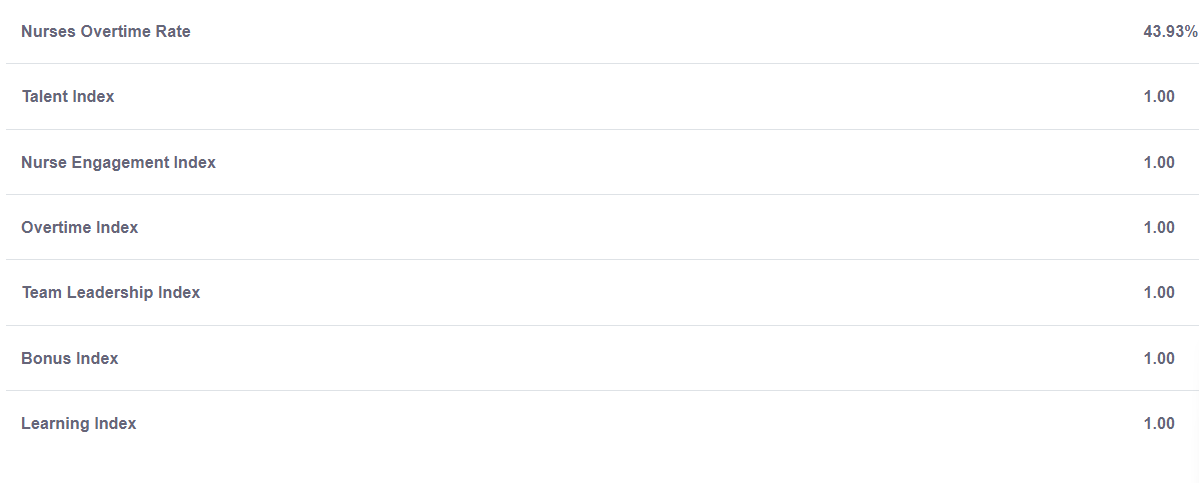
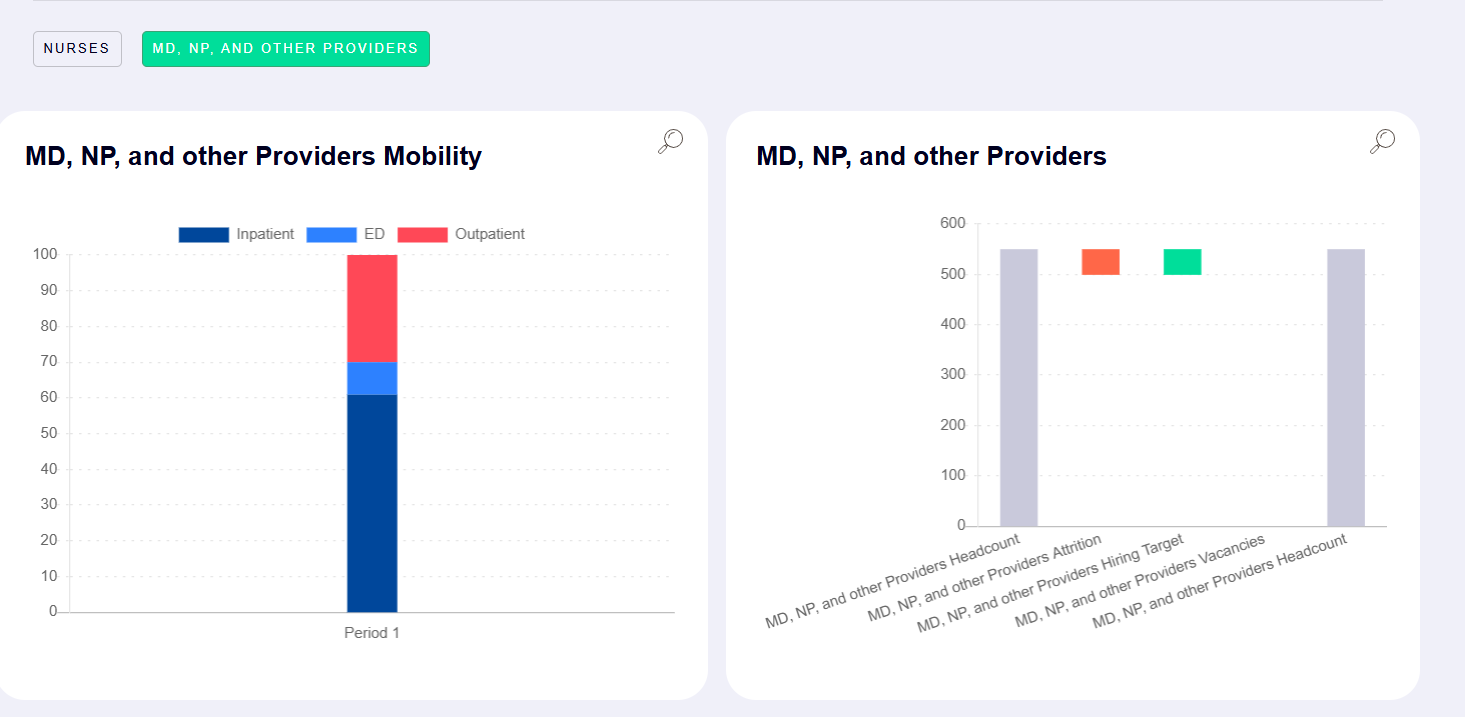
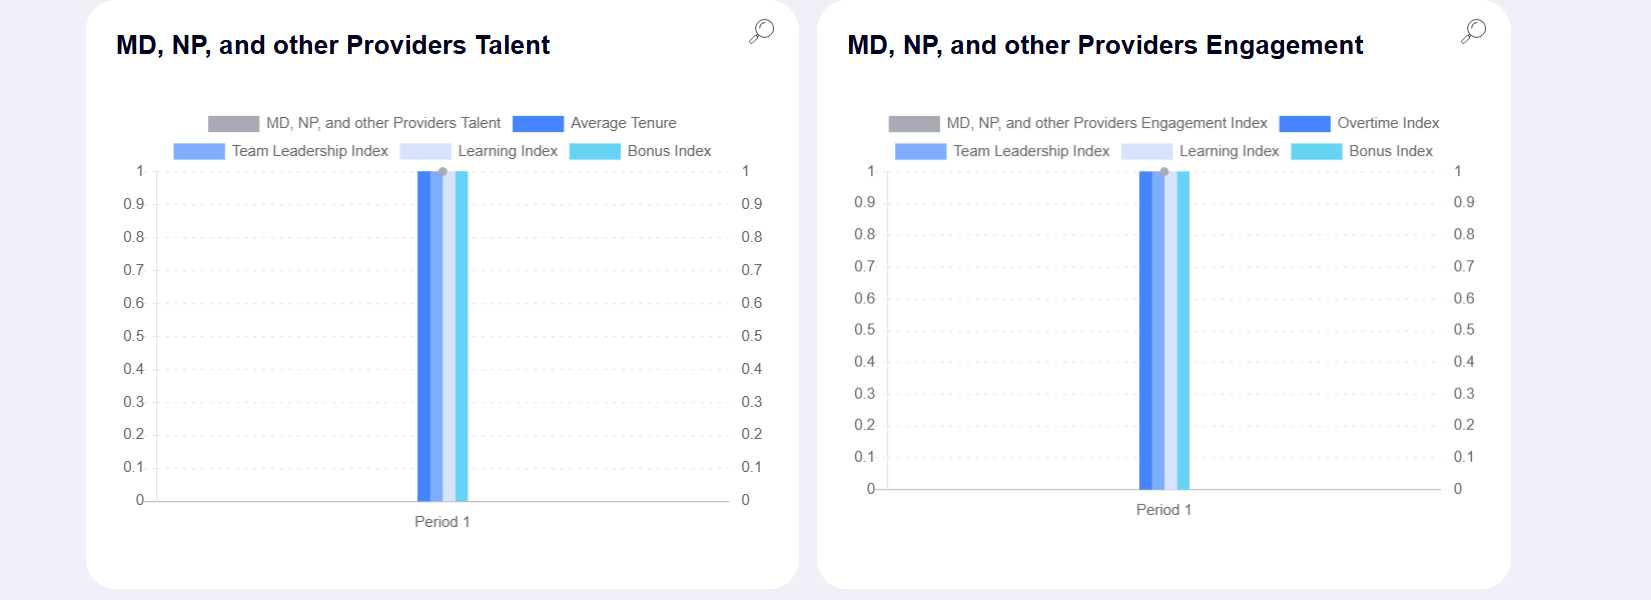
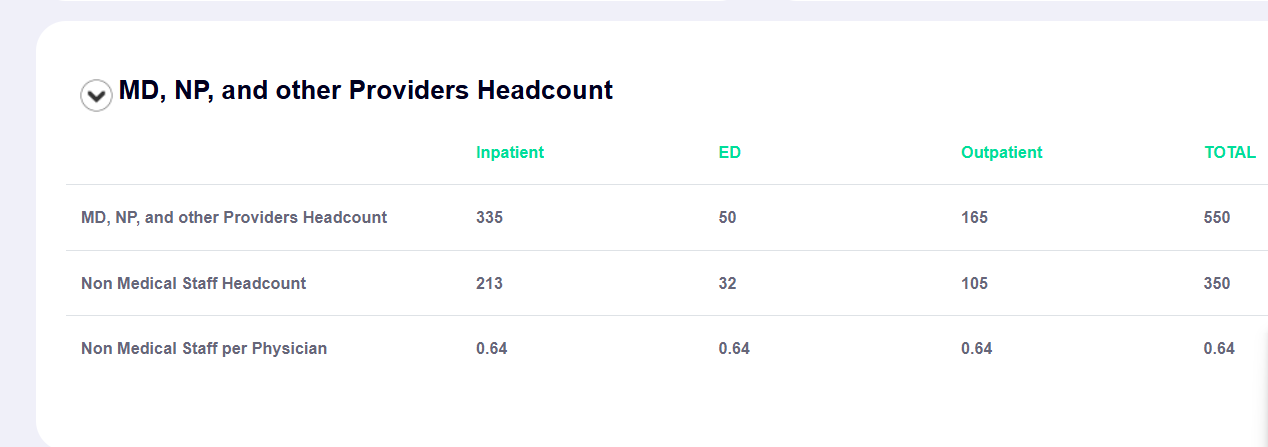
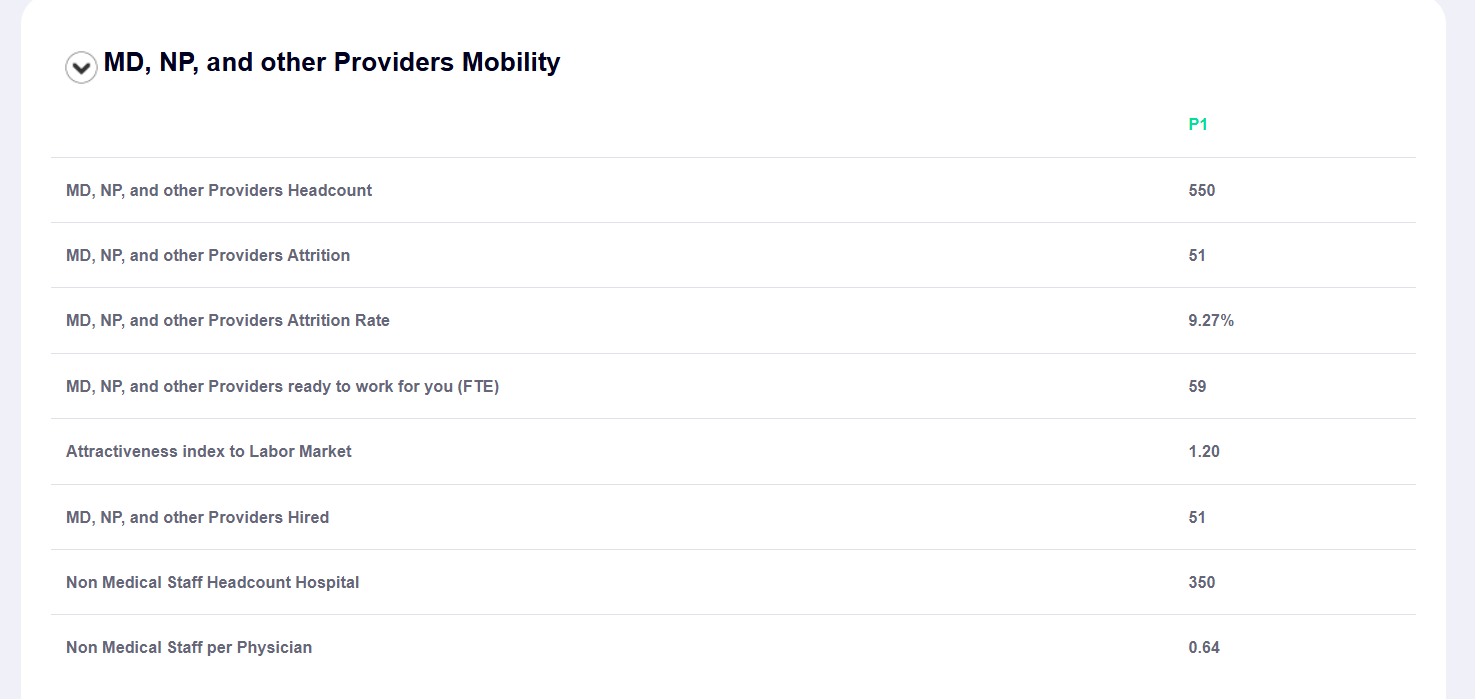
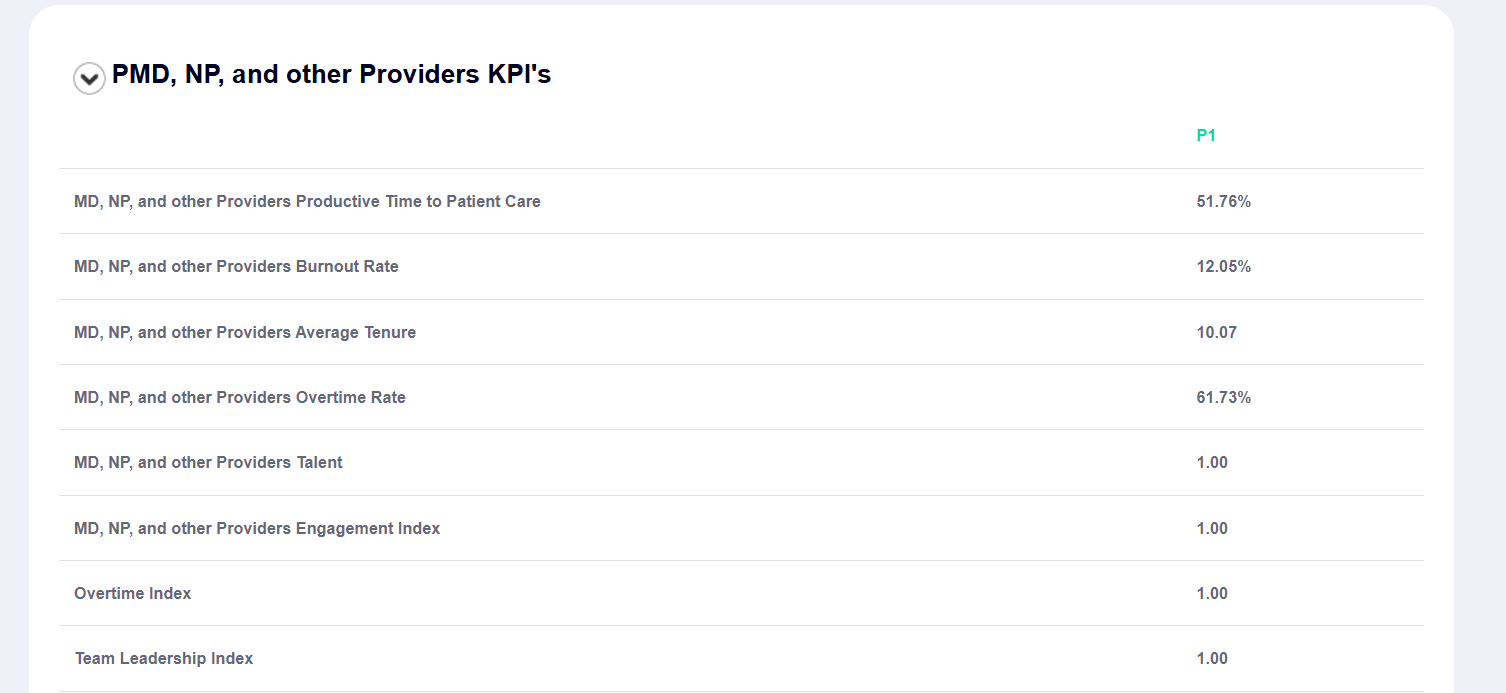
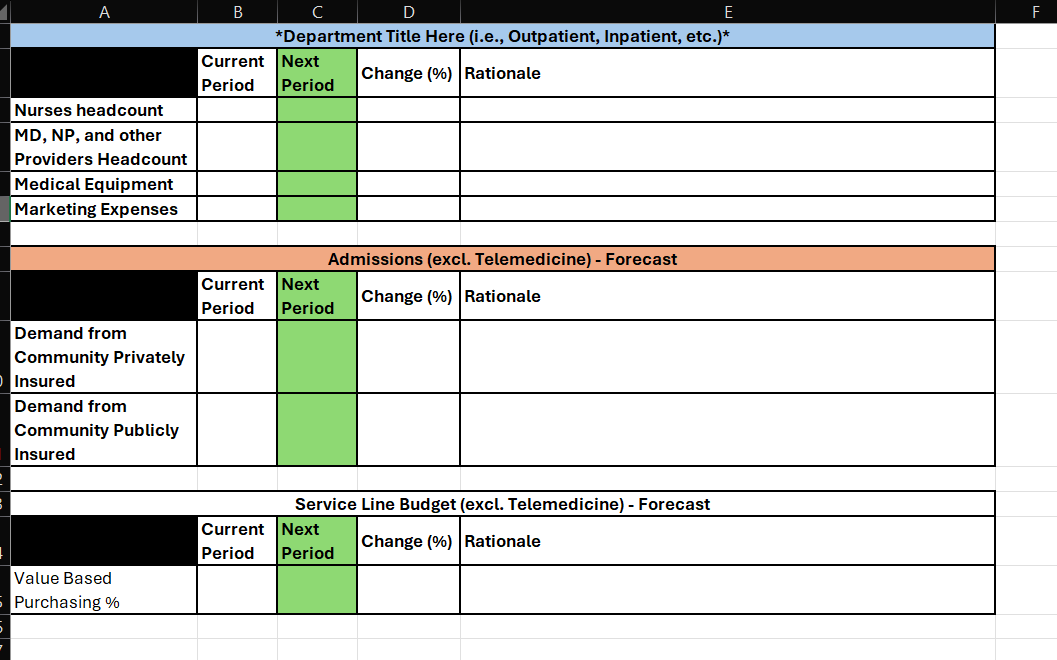
FINANCIAL STATEMENT CLINICAL LINES HUMAN CAPITAL TELEMEDICINE OPIOID NURSES MD, NP, AND OTHER PROVIDERS Nurses Mobility Nurses 900 Inpatient ED Outpatient 100 800 90 700 80 600 70 500 60 400 50 40 300 30 200 20 100 10 Nurses headcount Nurses Attrition Nurses Promoted Nurses Hiring Target Nurses Vacancies Nurses headcount Period 1FINANCIAL STATEMENT CLINICAL LINES HUMAN CAPITAL TELEMEDICINE OPIOID NURSES MD, NP, AND OTHER PROVIDERS Nurses Mobility Nurses 900 Inpatient ED Outpatient 100 800 90 700 80 600 70 500 60 400 50 300 40 30 200 20 100 10 Nurses headcount Nurses Attrition Nurses Promoted Nurses Hiring Target Nurses Vacancies Nurses headcount Period 1Nurses Talent Nurses Engagement Talent Index Average Tenure Team Leadership Index Nurse Engagement Index Impact of Overtime Learning Index Bonus Index Team Leadership Index Learning Index Bonus Index 1 1 1 0.9 0.9 0.9 0.9 0.8 0.8 0.8 0.8 0.7 0.7 0.7 0.7 0.6 0.6 0.6 0.6 0.5 0.5 0.5 0.5 0.4 0.4 0.4 0.4 0.3 0.3 0.3 0.3 0.2 0.2 0.2 0.2 0.1 0.1 0.1 0.1 O 0 0 Period 1 Period 1Nurses headcount Inpatient ED Outpatient TOTAL Nurses headcount 730 67 53 850 Nurse Manager Headcount 24.05 2.21 1.75 28.00 Nurses per Nurse Manager 30 30 30 30v Nurses Mobility Nurses headcount Nurses Attrition Nurse Attrition Rate Nurses ready to work for you (FTE) Attractiveness index to Labor Market Nurses Hired Nurse Manager Headcount Nurses per Nurse Manager P1 850 149 17.68% 161 1.20 149 28 30 'v Nurses KPI's Nurse Productive Time to Patient Care Nurses Burnout Rate Nurses Average Tenure Nurses Overtime Rate Talent Index Nurse Engagement Index Overtime Index Team Leadership Index P1 68.78% 7.69% 43.93% 1.00 Nurses Overtime Rate Talent Index Nurse Engagement Index Overtime Index Team Leadership Index Bonus Index Learning Index 43.93% NURSES MD, NP, AND OTHER PROVIDERS MD, NP, and other Providers Mobility MD, NP, and other Providers 600 Inpatient ED Outpatient 100 500 90 80 400 70 300 60 50 200 40 100 30 20 10 MD, NP, and other Providers Attrition MD, NP, and other Providers Headcount MD, NP, and other Providers Vacancies MD, NP, and other Providers Headcount MD, NP, and other Providers Hiring Target O Period 1MD, NP, and other Providers Talent MD, NP, and other Providers Engagement MD, NP, and other Providers Talent Average Tenure MD, NP, and other Providers Engagement Index Overtime Index Team Leadership Index Learning Index Bonus Index Team Leadership Index Learning Index Bonus Index 1- 1 1 0.9 0.9 0.9 0.8 0.8 0.8 0.8 0.7 0.7 0.7 0.7 0.6 0.6 0.6 0.6 0.5 0.5 0.5 0.5 0.4 0.4 0.4 0.4 0.3 0.3 0.3 0.3 0.2 0.2 0.2 0.2 0.1 0.1 0.1 0.1 O 0 0 Period 1 Period 1MD, NP, and other Providers Headcount Inpatient ED Outpatient TOTAL MD, NP, and other Providers Headcount 335 50 165 550 Non Medical Staff Headcount 213 32 105 350 Non Medical Staff per Physician 0.64 0.64 0.64 0.64MD, NP, and other Providers Mobility P1 MD, NP, and other Providers Headcount 550 MD, NP, and other Providers Attrition 51 MD, NP, and other Providers Attrition Rate 9.27% MD, NP, and other Providers ready to work for you (FTE) 59 Attractiveness index to Labor Market 1.20 MD, NP, and other Providers Hired 51 Non Medical Staff Headcount Hospital 350 Non Medical Staff per Physician 0.64V PMD, NP, and other Providers KPI's P1 MD, NP, and other Providers Productive Time to Patient Care 51.76% MD, NP, and other Providers Burnout Rate 12.05% MD, NP, and other Providers Average Tenure 10.07 MD, NP, and other Providers Overtime Rate 61.73% MD, NP, and other Providers Talent 1.00 MD, NP, and other Providers Engagement Index 1.00 Overtime Index 1.00 Team Leadership Index 1.00\fA B C D E F *Department Title Here (i.e., Outpatient, Inpatient, etc.)* Current Next Change (%) | Rationale Period Period Nurses headcount MD, NP, and other Providers Headcount Medical Equipment Marketing Expenses Admissions (excl. Telemedicine) - Forecast Current Next Period Period Change (%) | Rationale Demand from Community Privately Insured Demand from Community Publicly Insured Service Line Budget (excl. Telemedicine) - Forecast Current Next Change (%) |Rationale Period Period Value Based Purchasing %
Step by Step Solution
There are 3 Steps involved in it

Get step-by-step solutions from verified subject matter experts