

Question: SIR MODEL PROBLEM, ONLY S AND I. S'=-aSI + bI; I'= aSI - bI, no R or R'. a = ?, b = 1/160; a
SIR MODEL PROBLEM, ONLY S AND I. S'=-aSI + bI; I'= aSI - bI, no R or R'. a = ?, b = 1/160; a is deduced by using the 20 added to I from S. S=1,000,000, I = 100, total population =1,000,100.
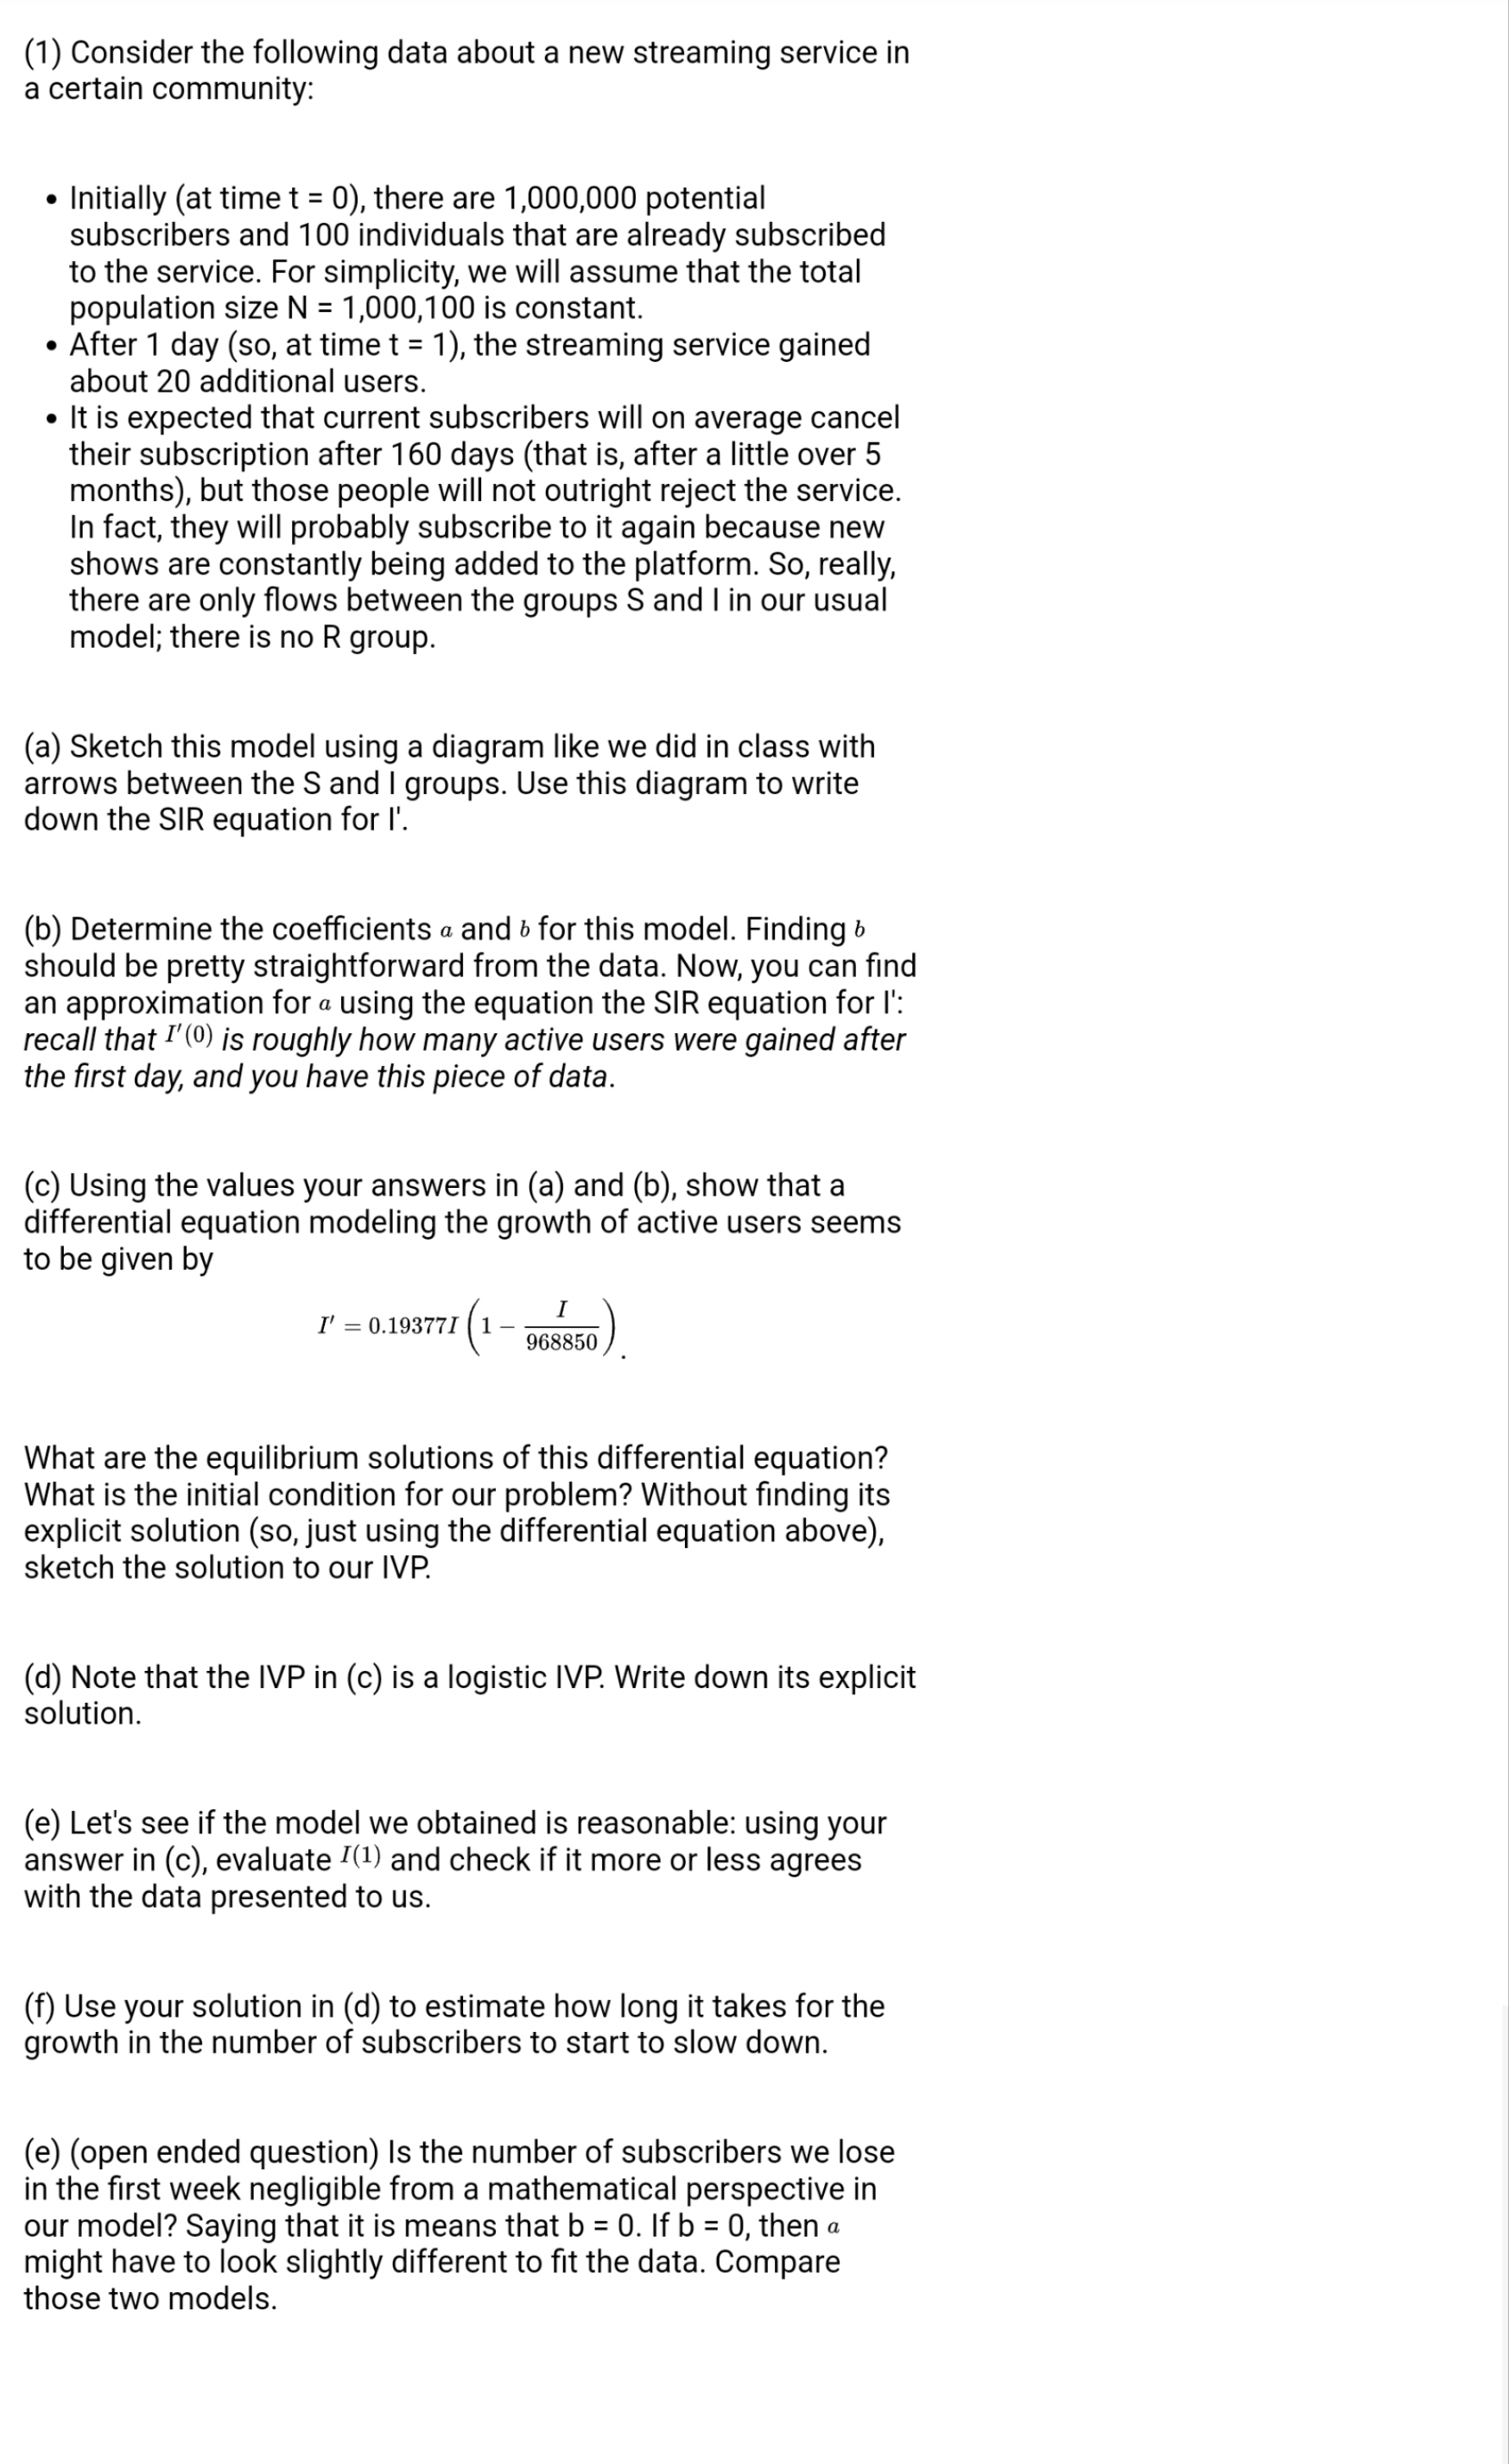
(1) Consider the following data about a new streaming service in a certain community: . Initially (at time t = 0), there are 1,000,000 potential subscribers and 100 individuals that are already subscribed to the service. For simplicity, we will assume that the total population size N = 1,000,100 is constant. . After 1 day (so, at time t = 1), the streaming service gained about 20 additional users. - It is expected that current subscribers will on average cancel their subscription after 160 days (that is, after a little over 5 months), but those people will not outright reject the service. In fact, they will probably subscribe to it again because new shows are constantly being added to the platform. 80, really, there are only ows between the groups S and | in our usual model; there is no R group. (a) Sketch this model using a diagram like we did in class with arrows between the S and | groups. Use this diagram to write down the SIR equation for l'. (b) Determine the coefcients a and b for this model. Finding I: should be pretty straightforward from the data. Now, you can nd an approximation fora using the equation the SIR equation for I': recall that 1'(0) is roughly how many active users were gained after the rst day, and you have this piece of data. (c) Using the values your answers in (a) and (b), show that a differential equation modeling the growth of active users seems to be given by I ' _ I 0.19377I (1 968850). What are the equilibrium solutions of this differential equation? What is the initial condition for our problem? Without nding its explicit solution (so, just using the differential equation above), sketch the solution to our IVP. (d) Note that the NP in (c) is a logistic IVP. Write down its explicit solution. (e) Let's see if the model we obtained is reasonable: using your answer in (c), evaluate 1(1) and check if it more or less agrees with the data presented to us. (f) Use your solution in (d) to estimate how long it takes for the growth in the number of subscribers to start to slow down. (e) (open ended question) Is the number of subscribers we lose in the rst week negligible from a mathematical perspective in our model? Saying that it is means that b = 0. If b = 0, then a might have to look slightly different to t the data. Compare those two models
Step by Step Solution
There are 3 Steps involved in it

Get step-by-step solutions from verified subject matter experts