

Question: Site Fixed Cost Per Year Variable Cost Per Unit 1) Draw the break even analysis chart and explain it. 2) Over what range of production
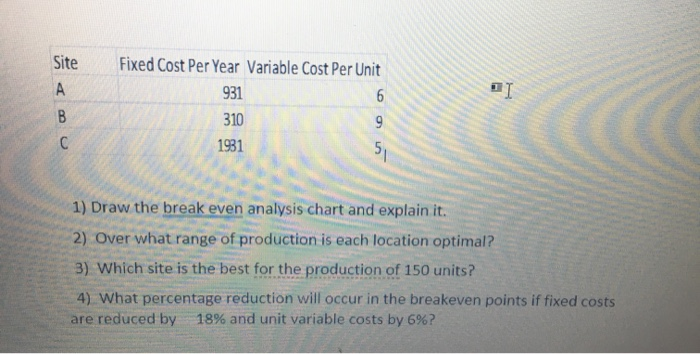
Site Fixed Cost Per Year Variable Cost Per Unit 1) Draw the break even analysis chart and explain it. 2) Over what range of production is each location optimal?! 3) Which site is the best for the production of 150 units? 4) What percentage reduction will occur in the breakeven points if fixed costs are reduced by 18% and unit variable costs by 6%?! Site Fixed Cost Per Year Variable Cost Per Unit 1) Draw the break even analysis chart and explain it. 2) Over what range of production is each location optimal?! 3) Which site is the best for the production of 150 units? 4) What percentage reduction will occur in the breakeven points if fixed costs are reduced by 18% and unit variable costs by 6%
Step by Step Solution
There are 3 Steps involved in it

Get step-by-step solutions from verified subject matter experts