

Question: Situation: Consider that you work for a Get It Tomorrow, a large online store. You have been tasked with understanding why there are so many
Situation: Consider that you work for a Get It Tomorrow, a large online store. You have been tasked with understanding why there are so many customer returns. In the Analyze phase of your Lean Six Sigma project, you decide to investigate potential causes for the high number of customer returns. To do this, you plan to use 5 whys/why-why analysis in conjunction with a cause-and-effect diagram. Then, you will collect data (you will use a data sheet in Workshop Resources) about the most significant potential causes of your problem and create a Pareto chart to determine the leading cause of this problem.
Project Title: Reduce the number of customer returns at Get It Tomorrow
Problem Statement: The number of customer returns is too high. This causes customer dissatisfaction as well as employee overtime and excessive costs of processing returns
Mission Statement: The goal of the project is to reduce the number of customer returns. By reducing these returns, customers will be more satisfied with their original purchase. Employee overtime will be reduced as well as return processing costs.
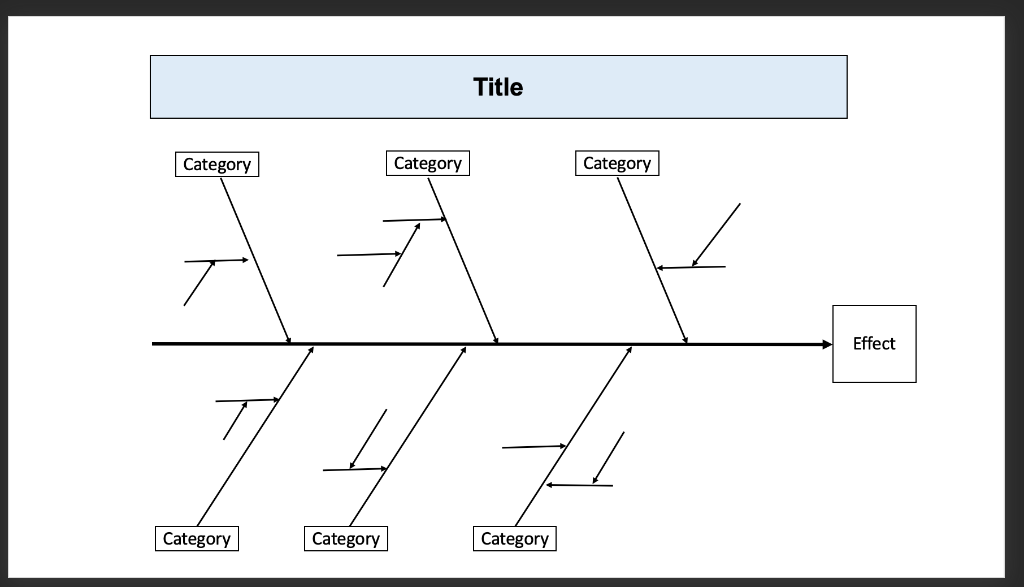
Cause and Effect Diagram:
After completing your cause-and-effect diagram, reflect on all the items listed and select what you believe are the top five potential causes of the problem (these can be causes, sub-causes, and/or sub-sub-causes). Circle these causes and label these with the numbers 1-5, where "1" represents what you believe is the leading cause of the problem on the Cause and Effect diagram.
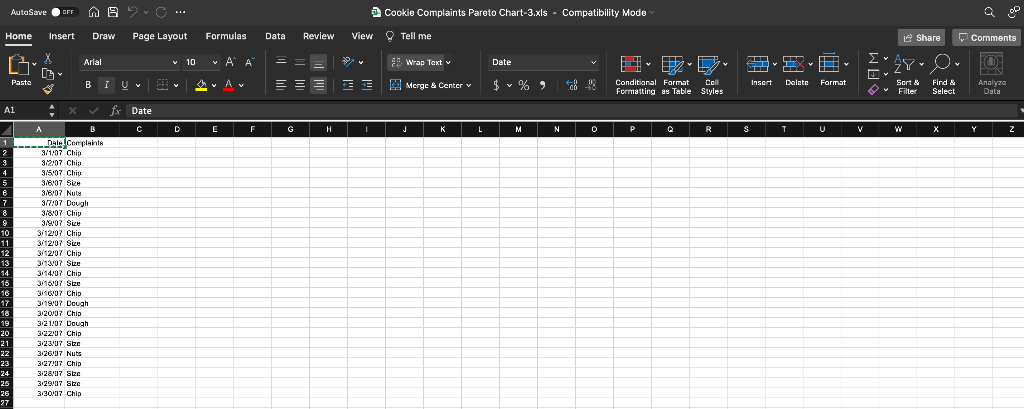
Pareto Chart:
Then, obtain the file Customer Returns Pareto Chart Workshop Data.xls from Blackboard. This file is meant to simulate the process of you collecting data about the top 5 causes of your problem. Pretend the data in this file was collected from customer returns data, with causes being tracked. The data in this file are already "coded" for you, so all you need to do is fill-in the "key" (based on the items you labeled 1-5 in your cause-and-effect diagram) so you will know what each number represents. You can then create your Pareto chart using this data in Microsoft Excel.
Activities:
- Create a cause-and-effect diagram (using 5 whys/why-why analysis) that organizes potential causes for high customer returns: There must be at least 5 main categories. Circle and number the 5 causes that you think are the "main causes" of the problem.
2. Create a Pareto chart that depicts the causes for the high customer returns:
3. Based on the Pareto chart you created for Activity #2 of this Workshop, what cause of the problem should you address first in your Lean Six Sigma project and why?
4. Did the results of your Pareto chart surprise you (i.e., was the order of the actual top 5 causes of the problem shown in your Pareto chart different than what you had originally identified in your cause-and-effect diagram)? What does this illustrate about the importance of collecting data about a problem versus using only instinct/intuition?
Title Category Category Category Effect 7 Category Category Category AutoSave OFF w Suc... Cookie Complaints Pareto Chart-3.xls - Compatibility Mode a Home Insert Draw Page Layout Formulas Data Review View Tell me Share Comments Arial Y 10 VAA Wrap Text Date 3-ERIE AYO Pasta # ; Bi Vw Av = = EE 09 Y $ % ) Merge & Center v Cold Insert Delete Format Conditional Format Call Formatting as Table Styles Sort & Filter Find & Select Analyze Data 1 fx Date C D E F G H J L M N 0 P R S T T U V W 1 2 5 6 7 8 9 10 11 12 13 14 16 16 17 18 19 20 21 22 23 24 26 26 27 A Date Complaints 3/1/07 Chip 32:07 Chip 3/5'07 Chip 318/07 Size 318407 Nuts 3/7/07 Dough 318/07 Chip 3/9/07 Sice 3/12/07 Chip 3/12/07 Size 3/12 07 Chip 3113107 Sten 3/14/07 Chip 3/16/07 Size 3/16'07 Chip 3/19'07 Dough 3:20'07 Chip 3:21:07 Dough 3:22:07 Chip 323/07 Size 3:26'07 Nuts 3:27:07 Chip 3:28'07 Size 3:29'07 Se 3180 Chic 3/20/07 Chip Title Category Category Category Effect 7 Category Category Category AutoSave OFF w Suc... Cookie Complaints Pareto Chart-3.xls - Compatibility Mode a Home Insert Draw Page Layout Formulas Data Review View Tell me Share Comments Arial Y 10 VAA Wrap Text Date 3-ERIE AYO Pasta # ; Bi Vw Av = = EE 09 Y $ % ) Merge & Center v Cold Insert Delete Format Conditional Format Call Formatting as Table Styles Sort & Filter Find & Select Analyze Data 1 fx Date C D E F G H J L M N 0 P R S T T U V W 1 2 5 6 7 8 9 10 11 12 13 14 16 16 17 18 19 20 21 22 23 24 26 26 27 A Date Complaints 3/1/07 Chip 32:07 Chip 3/5'07 Chip 318/07 Size 318407 Nuts 3/7/07 Dough 318/07 Chip 3/9/07 Sice 3/12/07 Chip 3/12/07 Size 3/12 07 Chip 3113107 Sten 3/14/07 Chip 3/16/07 Size 3/16'07 Chip 3/19'07 Dough 3:20'07 Chip 3:21:07 Dough 3:22:07 Chip 323/07 Size 3:26'07 Nuts 3:27:07 Chip 3:28'07 Size 3:29'07 Se 3180 Chic 3/20/07 Chip
Step by Step Solution
There are 3 Steps involved in it

Get step-by-step solutions from verified subject matter experts