

Question: Six scatter plots are shown comparing bivariate data. A= the scatter plot with the correlation coefficient, r closest to 1 is.... B = The scatter
Six scatter plots are shown comparing bivariate data.
A= the scatter plot with the correlation coefficient, r closest to 1 is....
B = The scatter plot with the correlation coefficient r closest to -1 is
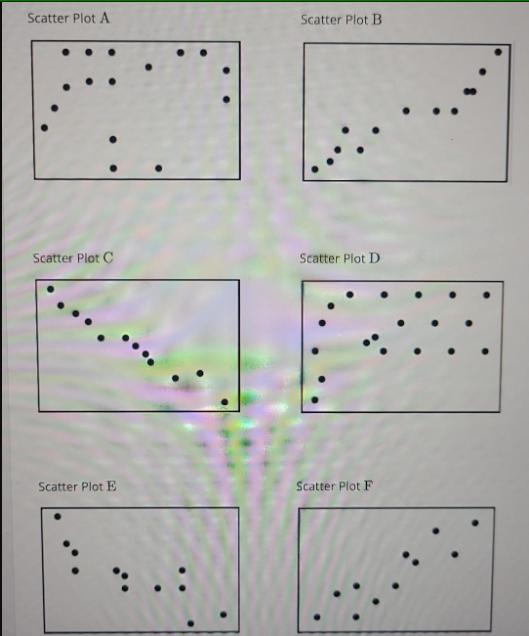
Scatter Plot A Scatter Plot C Scatter Plot E Scatter Plot B Scatter Plot D Scatter Plot F
Step by Step Solution
There are 3 Steps involved in it
1 Expert Approved Answer
Step: 1 Unlock

Correlation coefficient r is about linearity if data is close ... View full answer
Question Has Been Solved by an Expert!
Get step-by-step solutions from verified subject matter experts
Step: 2 Unlock
Step: 3 Unlock