

Question: SJ has the viscosity ( y-axis) versus shear rate ( x-axis) plot of her material, as shown below on log-log scale plot. [Note that the
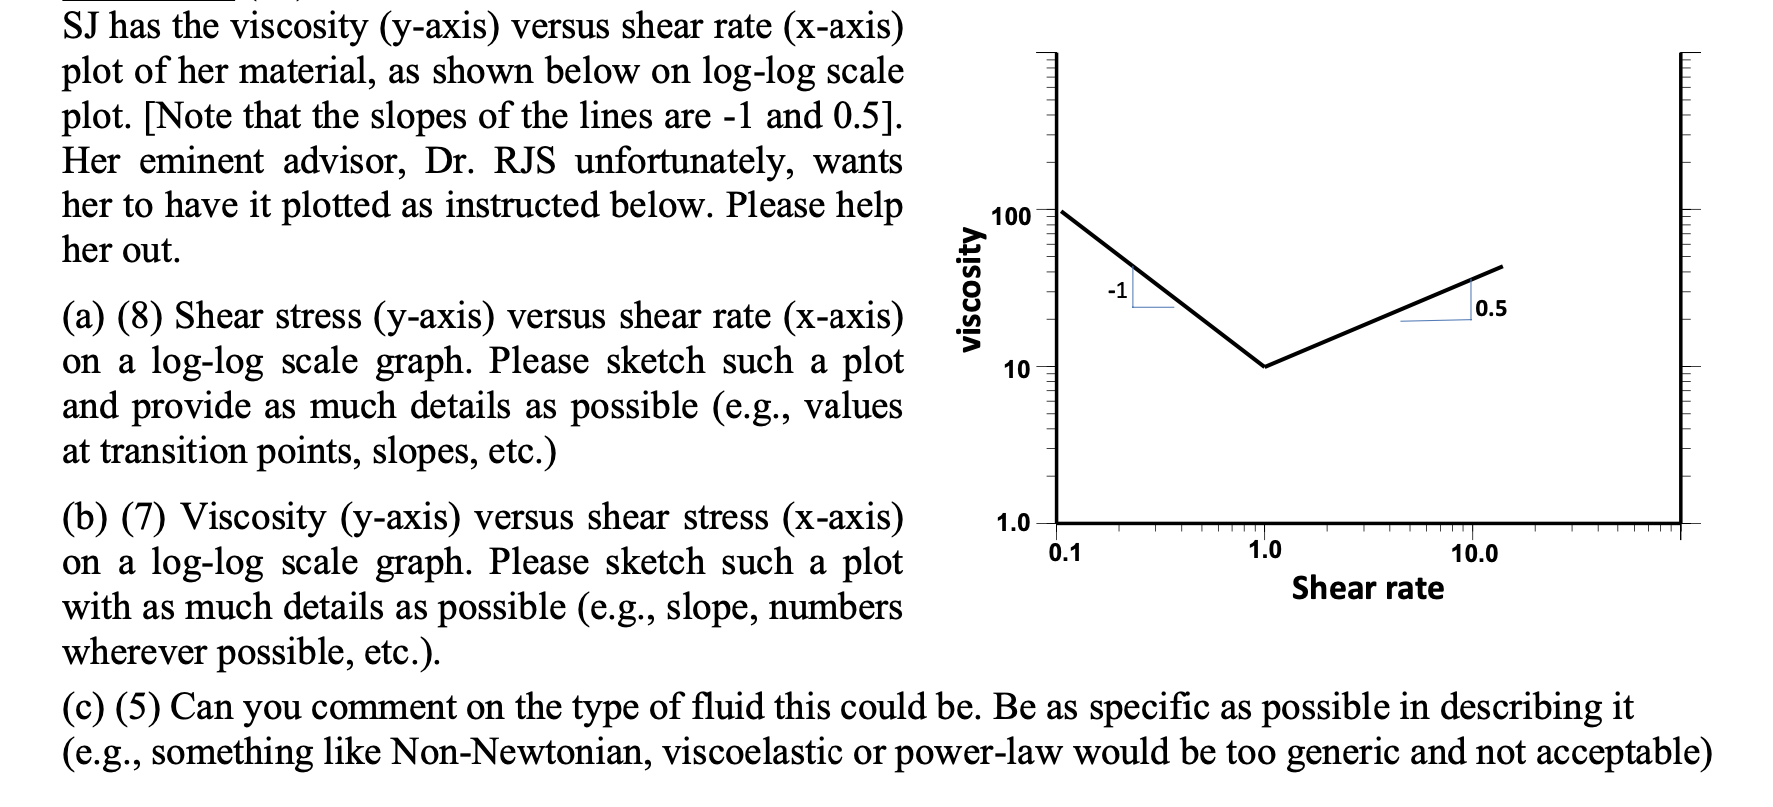
SJ has the viscosity ( y-axis) versus shear rate ( x-axis) plot of her material, as shown below on log-log scale plot. [Note that the slopes of the lines are -1 and 0.5]. Her eminent advisor, Dr. RJS unfortunately, wants her to have it plotted as instructed below. Please help her out. (a) (8) Shear stress (y-axis) versus shear rate ( x-axis) on a log-log scale graph. Please sketch such a plot and provide as much details as possible (e.g., values at transition points, slopes, etc.) (b) (7) Viscosity (y-axis) versus shear stress (x-axis) on a log-log scale graph. Please sketch such a plot with as much details as possible (e.g., slope, numbers wherever possible, etc.). (c) (5) Can you comment on the type of fluid this could be. Be as specific as possible in describing it (e.g., something like Non-Newtonian, viscoelastic or power-law would be too generic and not acceptable)
Step by Step Solution
There are 3 Steps involved in it

Get step-by-step solutions from verified subject matter experts