

Question: sketch the graph and show all working 1. This table shows the numbers of days absent from mathematics class and the math marks for 15
sketch the graph and show all working
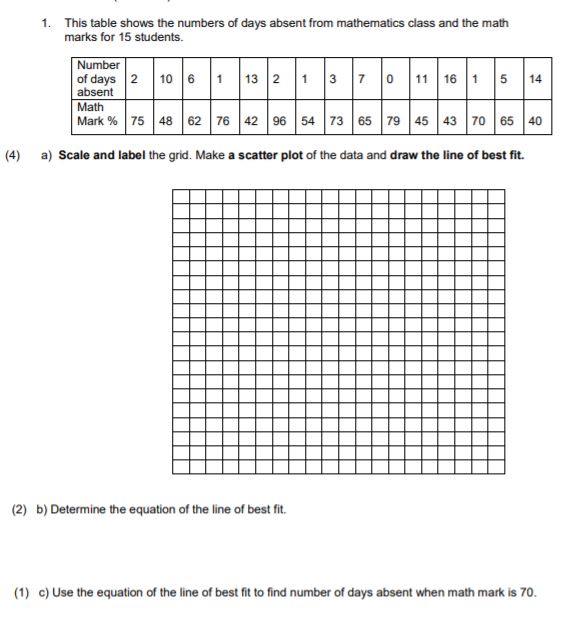
1. This table shows the numbers of days absent from mathematics class and the math marks for 15 students. Number of days 2 10 6 13 3 16 5 14 absent Math Mark % 75 48 76 42 96 54 73 65 79 45 43 70 65 40 (4) a) Scale and label the grid. Make a scatter plot of the data and draw the line of best fit. (2) b) Determine the equation of the line of best fit. (1) c) Use the equation of the line of best fit to find number of days absent when math mark is 70
Step by Step Solution
There are 3 Steps involved in it
1 Expert Approved Answer
Step: 1 Unlock

Question Has Been Solved by an Expert!
Get step-by-step solutions from verified subject matter experts
Step: 2 Unlock
Step: 3 Unlock