

Question: slide 53 slide 55 Fill out the printer in the form 2. (5 pt) The following is the map of Storage Blocks Allocation for three
slide 53
slide 55
Fill out the printer in the form
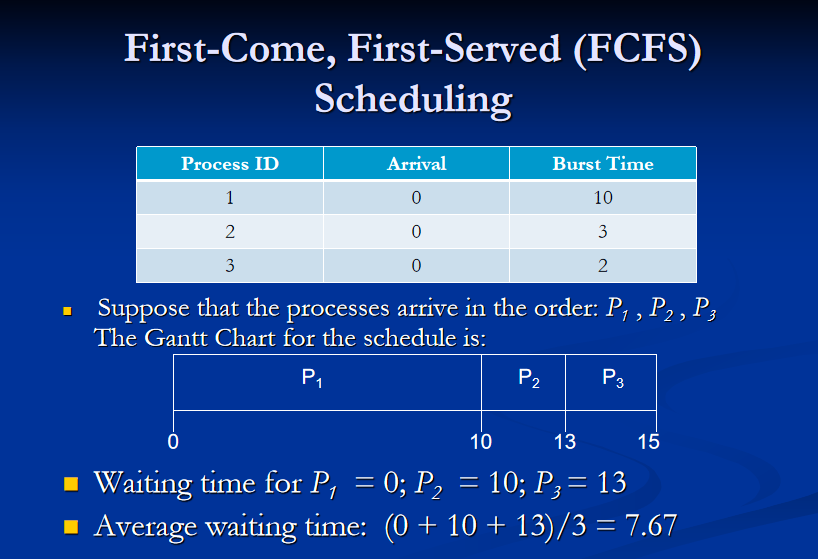
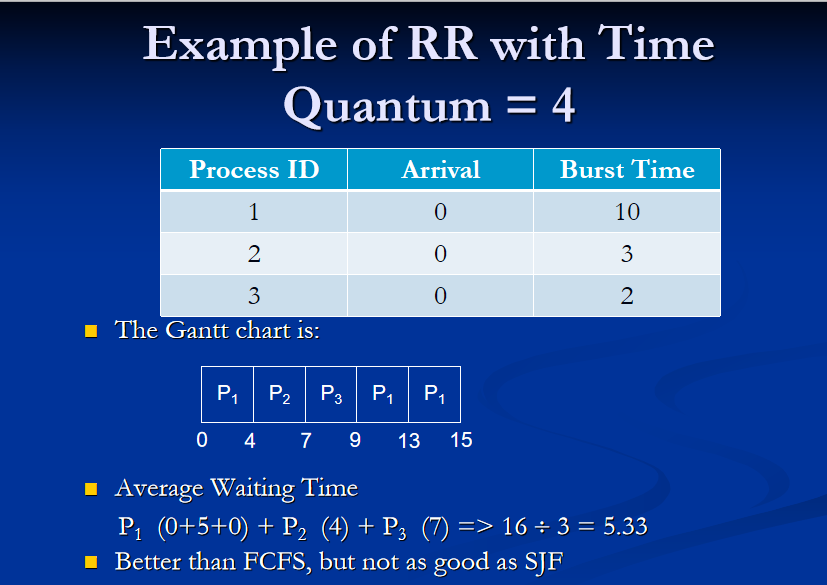
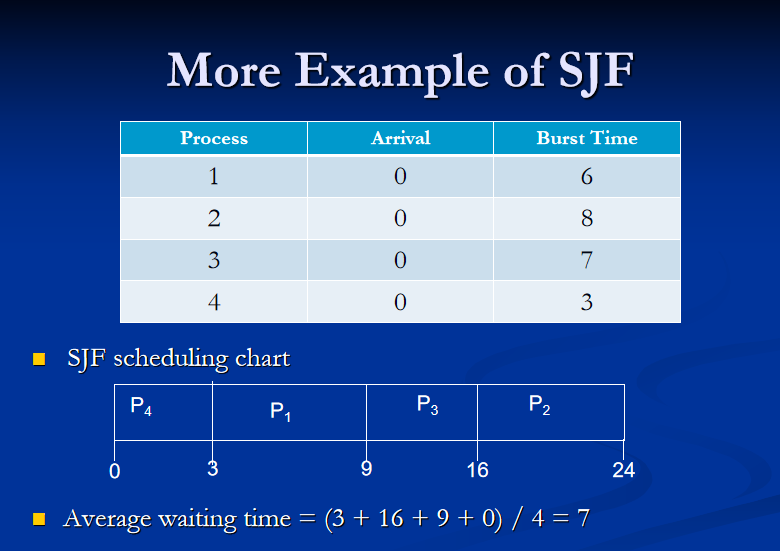
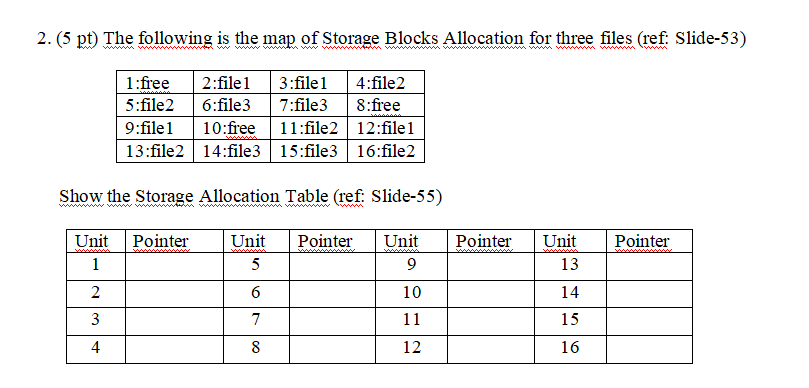
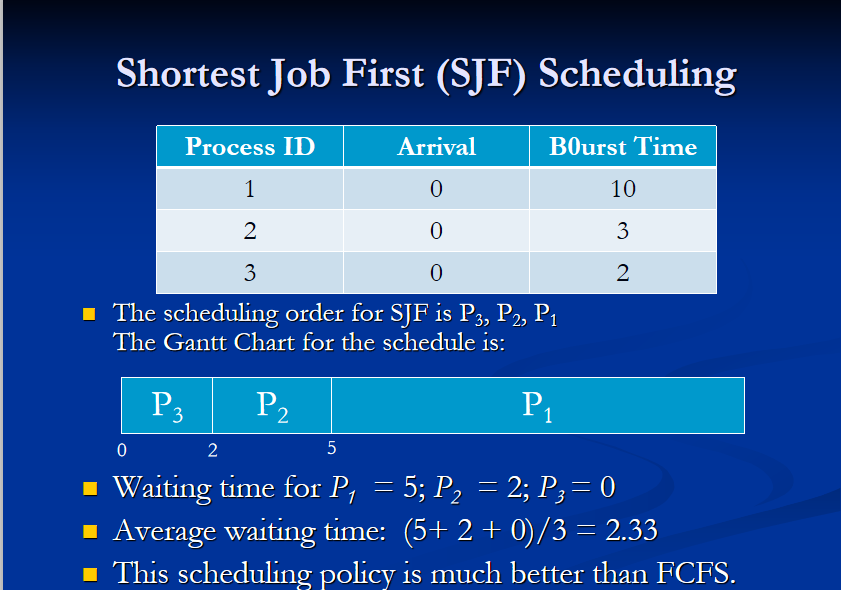
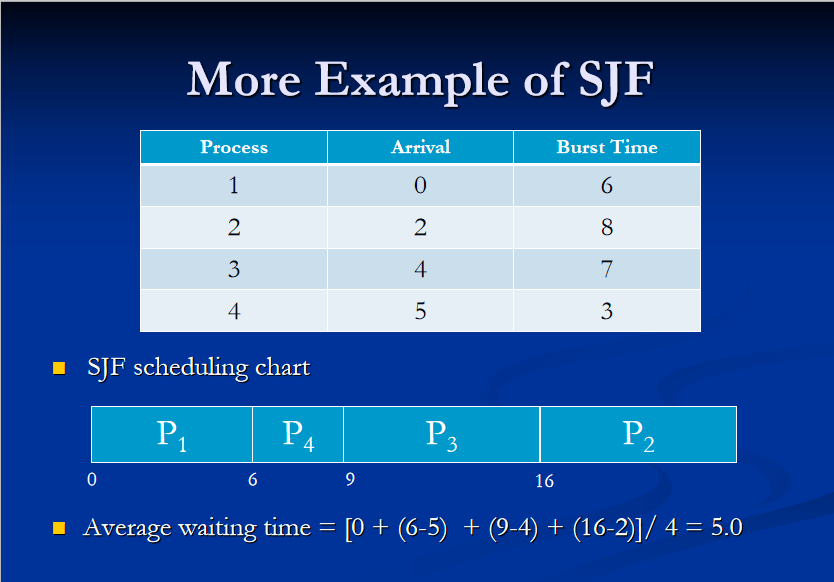
2. (5 pt) The following is the map of Storage Blocks Allocation for three files (ref: Slide-53) | 1:free 2:file1 3:file1 4:file2 5:file2 6:file3 7:file3 8:free 9:file1 10:free | 11:file2 | 12:file1 | 13:file2 | 14:file3 | 15:file3 | 16:file2 Show the Storage Allocation Table (ref: Slide-55) Unit Pointer Unit Pointer UnitPointer Pointer 5 9 Unit 13 14 6 10 11 12 15 16 Shortest Job First (SJF) Scheduling Arrival Bourst Time Process ID 1 0. 10 2 0 3 0. The scheduling order for SJF is P3, P2, P1 The Gantt Chart for the schedule is: P3 P2 o 2 5 - Waiting time for P = 5; P, = 2; P, = 0 - Average waiting time: (5+ 2 + 0)/3 = 2.33 This scheduling policy is much better than FCFS. More Example of SJF Process Arrival Burst Time 3 SJF scheduling chart . . . , 9 Average waiting time = [0 + (6-5) + (9-4) + (16-2)]/ 4 = 5.0 16 First-Come, First-Served (FCFS) Scheduling Process ID Arrival Burst Time 10 0 0 Suppose that the processes arrive in the order: P, , P2, P3 The Gantt Chart for the schedule is: P2 P3 P1 10 13 15 Waiting time for P, = 0; P, = 10; P, = 13 - Average waiting time: (0 + 10 + 13)/3 = 7.67 Example of RR with Time Quantum = 4 Process ID Arrival 0 0 0 Burst Time 10 3 2 2 3 The Gantt chart is: | Pi | P2|P3 | P1 | Pi 0 4 7 9 13 15 Average Waiting Time P, (0+5+0) + P2 (4) + P3 (7) => 16 + 3 = 5.33 - Better than FCFS, but not as good as SJF More Example of SJF Process Arrival Burst Time O 3 4 0 SJF scheduling chart PAP, PP, 6 16 24 Average waiting time = (3 + 16 + 9 + 0) / 4 = 7 2. (5 pt) The following is the map of Storage Blocks Allocation for three files (ref: Slide-53) | 1:free 2:file1 3:file1 4:file2 5:file2 6:file3 7:file3 8:free 9:file1 10:free | 11:file2 | 12:file1 | 13:file2 | 14:file3 | 15:file3 | 16:file2 Show the Storage Allocation Table (ref: Slide-55) Unit Pointer Unit Pointer UnitPointer Pointer 5 9 Unit 13 14 6 10 11 12 15 16 Shortest Job First (SJF) Scheduling Arrival Bourst Time Process ID 1 0. 10 2 0 3 0. The scheduling order for SJF is P3, P2, P1 The Gantt Chart for the schedule is: P3 P2 o 2 5 - Waiting time for P = 5; P, = 2; P, = 0 - Average waiting time: (5+ 2 + 0)/3 = 2.33 This scheduling policy is much better than FCFS. More Example of SJF Process Arrival Burst Time 3 SJF scheduling chart . . . , 9 Average waiting time = [0 + (6-5) + (9-4) + (16-2)]/ 4 = 5.0 16 First-Come, First-Served (FCFS) Scheduling Process ID Arrival Burst Time 10 0 0 Suppose that the processes arrive in the order: P, , P2, P3 The Gantt Chart for the schedule is: P2 P3 P1 10 13 15 Waiting time for P, = 0; P, = 10; P, = 13 - Average waiting time: (0 + 10 + 13)/3 = 7.67 Example of RR with Time Quantum = 4 Process ID Arrival 0 0 0 Burst Time 10 3 2 2 3 The Gantt chart is: | Pi | P2|P3 | P1 | Pi 0 4 7 9 13 15 Average Waiting Time P, (0+5+0) + P2 (4) + P3 (7) => 16 + 3 = 5.33 - Better than FCFS, but not as good as SJF More Example of SJF Process Arrival Burst Time O 3 4 0 SJF scheduling chart PAP, PP, 6 16 24 Average waiting time = (3 + 16 + 9 + 0) / 4 = 7
Step by Step Solution
There are 3 Steps involved in it

Get step-by-step solutions from verified subject matter experts