

Question: Smith and Johnson Manufacturing has decided to use a p-Chart with 2-sigma control limits to monitor the proportion of defective steel bars produced by their
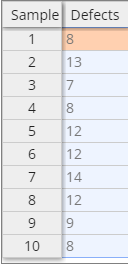
Smith and Johnson Manufacturing has decided to use a p-Chart with 2-sigma control limits to monitor the proportion of defective steel bars produced by their production process. The quality control manager randomly samples 200 steel bars at 10 successively selected time periods and counts the number of defective steel bars in the sample.
Table
Step1of8:
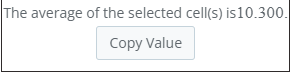
What is the Center Line of the control chart? Round your answer to three decimal places.
Step 2 of 8: What value of z should be used to construct the control chart?
Step 3 of 8: What is the Upper Control Limit? Round your answer to three decimal places.
Step 4 of 8: What is the Lower Control Limit? Round your answer to three decimal places.
Step by Step Solution
There are 3 Steps involved in it

Get step-by-step solutions from verified subject matter experts