

Question: Snap DCF Analysis 2014 2015 2016 2017E 2018E 2019E 2020E 2021E 2022E 2023E 2024E 2025E Terminal Year Net revenue % change Y/Y Adjusted EBITDA
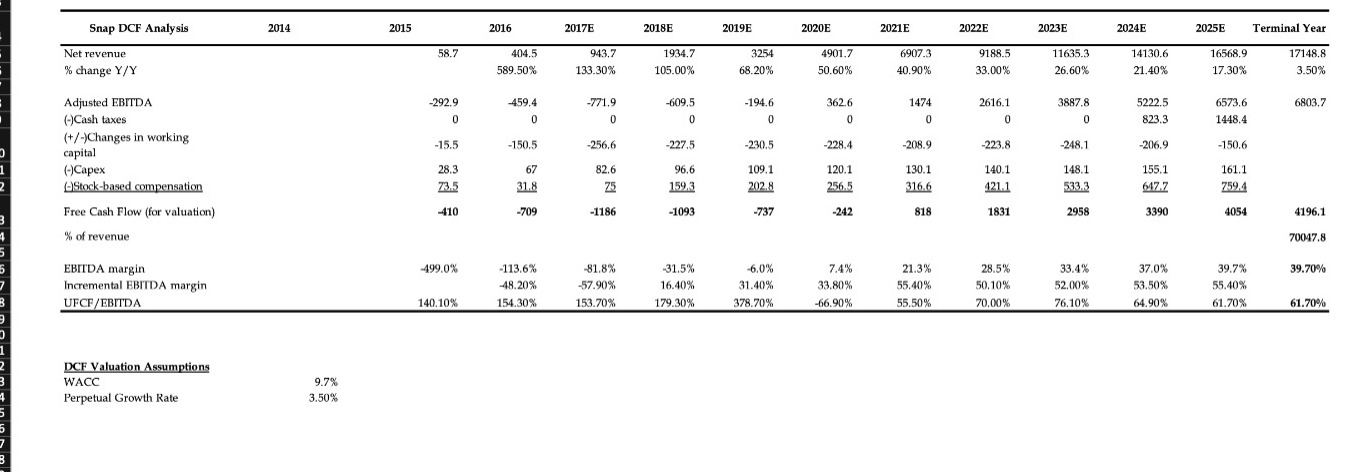
Snap DCF Analysis 2014 2015 2016 2017E 2018E 2019E 2020E 2021E 2022E 2023E 2024E 2025E Terminal Year Net revenue % change Y/Y Adjusted EBITDA 58.7 404.5 943.7 1934.7 3254 4901.7 6907.3 9188.5 11635.3 14130.6 16568.9 17148.8 589.50% 133.30% 105.00% 68.20% 50.60% 40.90% 33.00% 26.60% 21.40% 17.30% 3.50% (-)Cash taxes -292.9 0 -459.4 0 -771.9 0 -609.5 0 -194.6 362.6 0 0 1474 0 2616.1 0 3887.8 5222.5 6573.6 6803.7 0 823.3 1448.4 (+/-)Changes in working capital -15.5 -150.5 -256.6 -227.5 -230.5 -228.4 -208.9 -223.8 -248.1 -206.9 -150.6 (-)Capex 28.3 67 82.6 96.6 109.1 120.1 130.1 140.1 148.1 155.1 161.1 2 Stock-based compensation 73.5 31.8 75 159.3 202.8 256.5 316.6 421.1 533.3 647.7 759.4 Free Cash Flow (for valuation) -410 -709 -1186 -1093 -737 -242 818 1831 2958 3390 4054 4196.1 % of revenue 70047.8 B 9 EBITDA margin Incremental EBITDA margin UFCF/EBITDA -499.0% -113.6% -81.8% -31.5% -6.0% 7.4% 21.3% 28.5% 33.4% 37.0% 39.7% 39.70% -48.20% -57.90% 140.10% 154.30% 153.70% 16.40% 179.30% 31.40% 378.70% 33.80% 55.40% 50.10% 52.00% 53.50% 55.40% -66.90% 55.50% 70.00% 76.10% 64.90% 61.70% 61.70% DCF Valuation Assumptions WACC Perpetual Growth Rate 9.7% 3.50%
Step by Step Solution
There are 3 Steps involved in it

Get step-by-step solutions from verified subject matter experts