

Question: so base on these. Question 6 Analyze here the performance of BBTECH with respect to its growth in actual foreign currency earnings and the impact
 so base on these. Question 6 Analyze here the performance of BBTECH with respect to its growth in actual foreign currency earnings and the impact of the volatility of exchange rates on its consolidated profits.
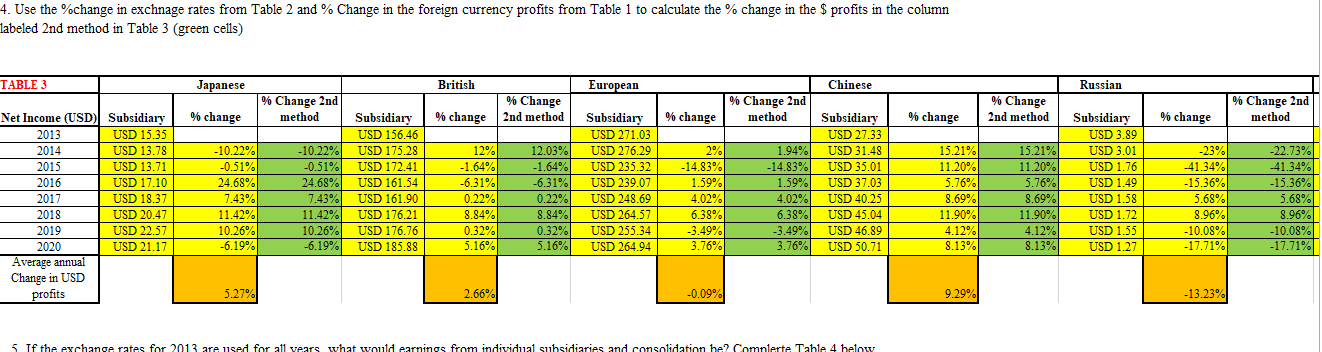
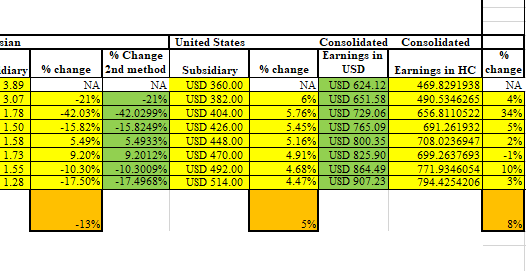
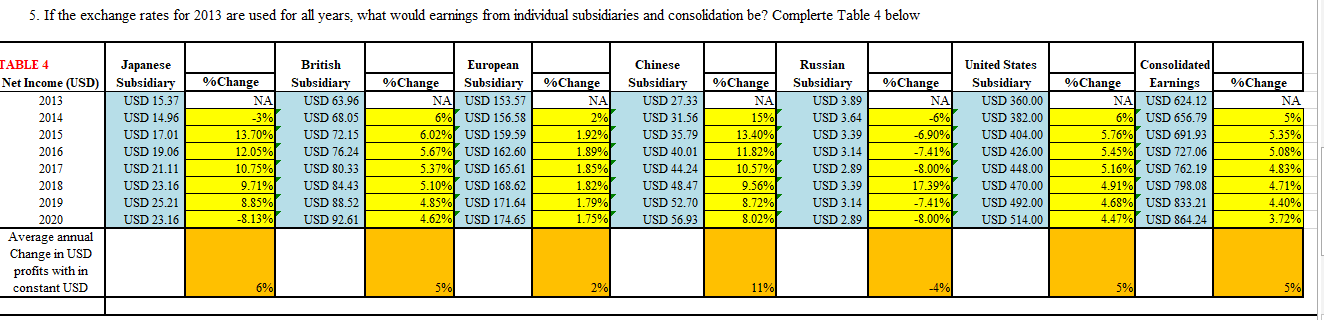
4. Use the change in exchnage rates from Table 2 and % Change in the foreign currency profits from Table 1 to calculate the % change in the $ profits in the column Labeled 2nd method in Table 3 (green cells) TABLE 3 Japanese British European Chinese Russian % Change 2nd method % Change 2nd method % Change 2nd method % Change 2nd method % Change 2nd method % change % change % change % change % change Net Income (USD) Subsidiary 2013 USD 15.35 2014 USD 13.78 2015 USD 13.71 2016 USD 17.10 2017 USD 18.37 2018 USD 20.47 2019 USD 22.57 2020 USD 21.17 Average annual Change in USD profits -10.22% -0.51% 24.68% 7.43% 11.42% 10.26% -6.19% -10.22% -0.51% 24.68% 7,43% 11.42% 10.26% -6.19% Subsidiary USD 156.46 USD 175.28 USD 172.41 USD 161.54 USD 161.90 USD 176.21 USD 176.76 USD 185.88 12% -1.64% -6.31% 0.22% 8.84% 0.32% 5.16% 12.03% -1.64% -6.31% 0.22% 8.84% 0.32% 5.16% Subsidiary USD 271.03 USD 276.29 USD 235.32 USD 239.07 USD 248.69 USD 264.57 USD 255.34 USD 264.94 2% -14.83% 1.59% 4.020 6.38% -3.49% 3.76% 1.94% -14.83% 1.59% 4.02% 6.38% -3.49% 3.76% Subsidiary USD 27.33 USD 31.48 USD 35.01 USD 37.03 USD 40.25 USD 45.04 USD 46.89 USD 50.71 15.21% 11.20% 5.76% 8.69% 11.90% 4.12% 8.13% 15.21% 11.20% 5.76% 8.69% 11.90% 4.12% 8.13% Subsidiary USD 3.89 USD 3.01 USD 1.76 USD 1.49 USD 1.58 USD 1.72 USD 1.55 USD 1.27 -23% -41.34% -15.36% 5.68% 8.96% -10.08% -17.71% -22.73% -41.34% -15.36% 5.68% 8.96% -10.08% -17.71% 5.27% 2.66% -0.09% 9.29% -13.23% 5 Tf the exchange rates for 2013 are used for all vears what would earnings from individual subsidiaries and consolidation he? Complerte Table 4 below sian United States diary 3.89 3.07 1.78 1.50 1.58 1.73 1.55 1.28 % Change % change 2nd method NA NA -21% -21% -42.03% -42.0299% -15.82% -15.8249% 5.49% 5.4933% 9.20% 9.2012% -10.30% -10.3009% -17.50% -17.4968% Subsidiary USD 360.00 USD 382.00 USD 404.00 USD 426.00 USD 448.00 USD 470.00 USD 492.00 USD 514.00 Consolidated Earnings in % change USD NA USD 624.12 6% USD 651.58 5.76% USD 729.06 5.45% USD 765.09 5.16% USD 800.35 4.91% USD 825.90 4.68% USD 864.49 4.47% USD 907.23 Consolidated % Earnings in HC change 469.8291938 NA 490.5346265 656.8110522 34% 691.261932 708.0236947 2% 699.2637693 -1% 771.9346054 10% 794.4254206 3% -13% 5% 8% 5. If the exchange rates for 2013 are used for all years, what would earnings from individual subsidiaries and consolidation be? Complerte Table 4 below %Change TABLE4 Net Income (USD) 2013 2014 2015 2016 Japanese Subsidiary USD 15.37 USD 14.96 USD 17.01 USD 19.06 USD 21.11 USD 23.16 USD 25.21 USD 23.16 %Change -3% 13.70% 12.05% 10.75% 9.71% 8.85% -8.13% British Subsidiary USD 63.96 USD 68.05 USD 72.15 USD 76.24 USD 80.33 USD 84.43 USD 88.52 USD 92.61 European %Change Subsidiary NA USD 153.57 6% USD 156.58 6.02% USD 159.59 5.67% USD 162.60 5.37% USD 165.61 5.10% USD 168.62 4.85% USD 171.64 4.62% USD 174.65 NA 2% 1.92% 1.89% 1.85% 1.82% 1.79%) 1.75% Chinese Subsidiary USD 27.33 USD 31.56 USD 35.79 USD 40.01 USD 44.24 USD 48.47 USD 52.70 USD 56.93 %Change NA 15% 13.40% 11.82% 10.579 9.56% 8.72% 8.02% Russian Subsidiary USD 3.89 USD 3.64 USD 3.39 USD 3.14 USD 2.89 USD 3.39 USD 3.14 USD 2.89 %Change NA -6% -6.90% -7.41% -8.00% 17.39% -7.41% -8.00% United States Subsidiary USD 360.00 USD 382.00 USD 404.00 USD 426.00 USD 448.00 USD 470.00 USD 492.00 USD 514.00 Consolidated %Change Earnings NA USD 624.12 6% USD 656.79 5.76% USD 691.93 5.45% USD 727.06 5.16% USD 762.19 4.91% USD 798.08 4.68% USD 833.21 4.47% USD 864.24 %Change NA 5% 5.35% 5.08% 4.83% 4.71% 4.40% 3.72% 2017 2018 2019 2020 Average annual Change in USD profits with in constant USD 6% 5% 2% 11% -4% 5% 5% 4. Use the change in exchnage rates from Table 2 and % Change in the foreign currency profits from Table 1 to calculate the % change in the $ profits in the column Labeled 2nd method in Table 3 (green cells) TABLE 3 Japanese British European Chinese Russian % Change 2nd method % Change 2nd method % Change 2nd method % Change 2nd method % Change 2nd method % change % change % change % change % change Net Income (USD) Subsidiary 2013 USD 15.35 2014 USD 13.78 2015 USD 13.71 2016 USD 17.10 2017 USD 18.37 2018 USD 20.47 2019 USD 22.57 2020 USD 21.17 Average annual Change in USD profits -10.22% -0.51% 24.68% 7.43% 11.42% 10.26% -6.19% -10.22% -0.51% 24.68% 7,43% 11.42% 10.26% -6.19% Subsidiary USD 156.46 USD 175.28 USD 172.41 USD 161.54 USD 161.90 USD 176.21 USD 176.76 USD 185.88 12% -1.64% -6.31% 0.22% 8.84% 0.32% 5.16% 12.03% -1.64% -6.31% 0.22% 8.84% 0.32% 5.16% Subsidiary USD 271.03 USD 276.29 USD 235.32 USD 239.07 USD 248.69 USD 264.57 USD 255.34 USD 264.94 2% -14.83% 1.59% 4.020 6.38% -3.49% 3.76% 1.94% -14.83% 1.59% 4.02% 6.38% -3.49% 3.76% Subsidiary USD 27.33 USD 31.48 USD 35.01 USD 37.03 USD 40.25 USD 45.04 USD 46.89 USD 50.71 15.21% 11.20% 5.76% 8.69% 11.90% 4.12% 8.13% 15.21% 11.20% 5.76% 8.69% 11.90% 4.12% 8.13% Subsidiary USD 3.89 USD 3.01 USD 1.76 USD 1.49 USD 1.58 USD 1.72 USD 1.55 USD 1.27 -23% -41.34% -15.36% 5.68% 8.96% -10.08% -17.71% -22.73% -41.34% -15.36% 5.68% 8.96% -10.08% -17.71% 5.27% 2.66% -0.09% 9.29% -13.23% 5 Tf the exchange rates for 2013 are used for all vears what would earnings from individual subsidiaries and consolidation he? Complerte Table 4 below sian United States diary 3.89 3.07 1.78 1.50 1.58 1.73 1.55 1.28 % Change % change 2nd method NA NA -21% -21% -42.03% -42.0299% -15.82% -15.8249% 5.49% 5.4933% 9.20% 9.2012% -10.30% -10.3009% -17.50% -17.4968% Subsidiary USD 360.00 USD 382.00 USD 404.00 USD 426.00 USD 448.00 USD 470.00 USD 492.00 USD 514.00 Consolidated Earnings in % change USD NA USD 624.12 6% USD 651.58 5.76% USD 729.06 5.45% USD 765.09 5.16% USD 800.35 4.91% USD 825.90 4.68% USD 864.49 4.47% USD 907.23 Consolidated % Earnings in HC change 469.8291938 NA 490.5346265 656.8110522 34% 691.261932 708.0236947 2% 699.2637693 -1% 771.9346054 10% 794.4254206 3% -13% 5% 8% 5. If the exchange rates for 2013 are used for all years, what would earnings from individual subsidiaries and consolidation be? Complerte Table 4 below %Change TABLE4 Net Income (USD) 2013 2014 2015 2016 Japanese Subsidiary USD 15.37 USD 14.96 USD 17.01 USD 19.06 USD 21.11 USD 23.16 USD 25.21 USD 23.16 %Change -3% 13.70% 12.05% 10.75% 9.71% 8.85% -8.13% British Subsidiary USD 63.96 USD 68.05 USD 72.15 USD 76.24 USD 80.33 USD 84.43 USD 88.52 USD 92.61 European %Change Subsidiary NA USD 153.57 6% USD 156.58 6.02% USD 159.59 5.67% USD 162.60 5.37% USD 165.61 5.10% USD 168.62 4.85% USD 171.64 4.62% USD 174.65 NA 2% 1.92% 1.89% 1.85% 1.82% 1.79%) 1.75% Chinese Subsidiary USD 27.33 USD 31.56 USD 35.79 USD 40.01 USD 44.24 USD 48.47 USD 52.70 USD 56.93 %Change NA 15% 13.40% 11.82% 10.579 9.56% 8.72% 8.02% Russian Subsidiary USD 3.89 USD 3.64 USD 3.39 USD 3.14 USD 2.89 USD 3.39 USD 3.14 USD 2.89 %Change NA -6% -6.90% -7.41% -8.00% 17.39% -7.41% -8.00% United States Subsidiary USD 360.00 USD 382.00 USD 404.00 USD 426.00 USD 448.00 USD 470.00 USD 492.00 USD 514.00 Consolidated %Change Earnings NA USD 624.12 6% USD 656.79 5.76% USD 691.93 5.45% USD 727.06 5.16% USD 762.19 4.91% USD 798.08 4.68% USD 833.21 4.47% USD 864.24 %Change NA 5% 5.35% 5.08% 4.83% 4.71% 4.40% 3.72% 2017 2018 2019 2020 Average annual Change in USD profits with in constant USD 6% 5% 2% 11% -4% 5% 5%
Step by Step Solution
There are 3 Steps involved in it

Get step-by-step solutions from verified subject matter experts