

Question: a. Suppose labor demand falls, shifting to the left, as in the figure. What does the short-run supply curve for labor (SRSL) look like
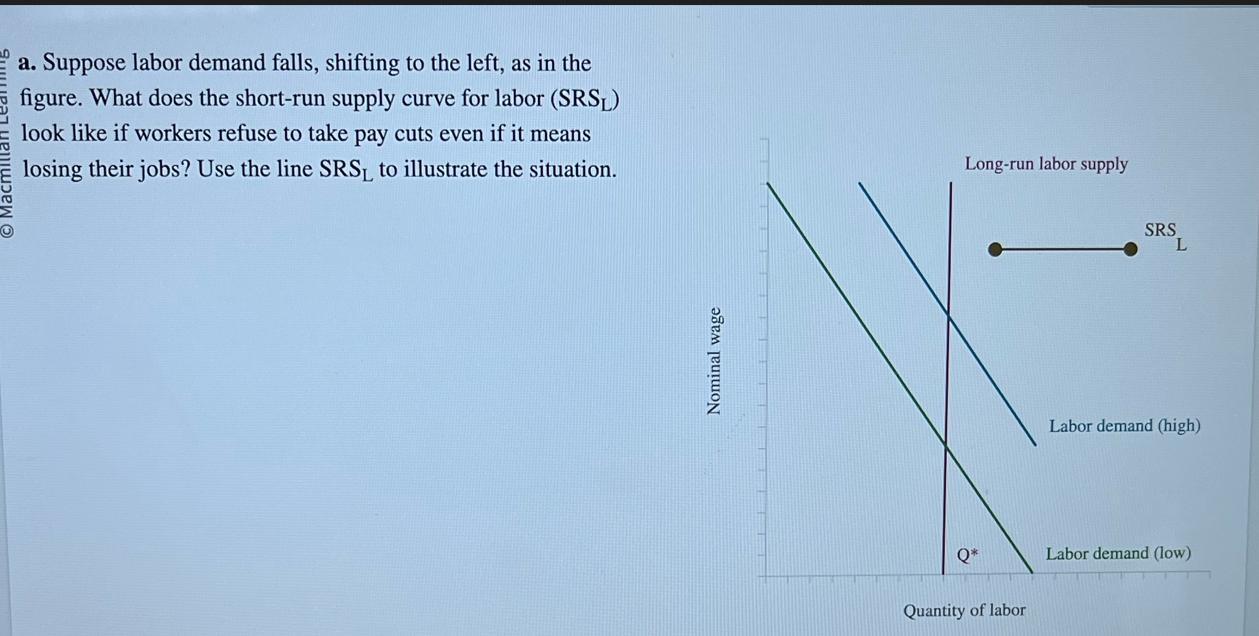
a. Suppose labor demand falls, shifting to the left, as in the figure. What does the short-run supply curve for labor (SRSL) look like if workers refuse to take pay cuts even if it means losing their jobs? Use the line SRS to illustrate the situation. Nominal wage Long-run labor supply Q* Quantity of labor SRS L Labor demand (high) Labor demand (low)
Step by Step Solution
★★★★★
3.58 Rating (148 Votes )
There are 3 Steps involved in it
1 Expert Approved Answer
Step: 1 Unlock

ANSWER In the scenario you described where labor demand falls and workers refuse to take pay cuts ev... View full answer
Question Has Been Solved by an Expert!
Get step-by-step solutions from verified subject matter experts
Step: 2 Unlock
Step: 3 Unlock