

Question: So for this project we have to read from a file named hewe.dat which is basically just height and weight of people (randomly generated) i
So for this project we have to read from a file named hewe.dat which is basically just height and weight of people (randomly generated) i will copy and paste the file below
This lab also uses the WINFIG program (to draw lines and make a bar chart) and im not sure how to link actual files that are not images to the question
# The comlete Human Weight/Height Dataset is available here. # Statistics Online Computational Resource (SOCR) # Index Height(Inches) Weight(Pounds) 1 65.78331 112.9925 2 71.51521 136.4873 3 69.39874 153.0269 4 68.2166 142.3354 5 67.78781 144.2971 6 68.69784 123.3024 7 69.80204 141.4947 8 70.01472 136.4623 9 67.90265 112.3723 10 66.78236 120.6672 11 66.48769 127.4516 12 67.62333 114.143 13 68.30248 125.6107 14 67.11656 122.4618 15 68.27967 116.0866 16 71.0916 139.9975 17 66.461 129.5023 18 68.64927 142.9733 19 71.23033 137.9025 20 67.13118 124.0449 21 67.83379 141.2807 22 68.87881 143.5392 23 63.48115 97.90191 24 68.42187 129.5027 25 67.62804 141.8501 26 67.20864 129.7244 27 70.84235 142.4235 28 67.49434 131.5502 29 66.53401 108.3324 30 65.44098 113.8922 31 69.5233 103.3016 32 65.8132 120.7536 33 67.8163 125.7886 34 70.59505 136.2225 35 71.80484 140.1015 36 69.20613 128.7487 37 66.80368 141.7994 38 67.65893 121.2319 39 67.80701 131.3478 40 64.04535 106.7115 41 68.57463 124.3598 42 65.18357 124.8591 43 69.65814 139.6711 44 67.96731 137.3696 45 65.98088 106.4499 46 68.67249 128.7639 47 66.88088 145.6837 48 67.69868 116.819 49 69.82117 143.6215 50 69.08817 134.9325 51 69.91479 147.0219 52 67.33182 126.3285 53 70.26939 125.4839 54 69.10344 115.7084 55 65.38356 123.4892 56 70.18447 147.8926 57 70.40617 155.8987 58 66.54376 128.0742 59 66.36418 119.3701 60 67.537 133.8148 61 66.50418 128.7325 62 68.99958 137.5453 63 68.30355 129.7604 64 67.01255 128.824 65 70.80592 135.3165 66 68.21951 109.6113 67 69.05914 142.4684 68 67.73103 132.749 69 67.21568 103.5275 70 67.36763 124.7299 71 65.27033 129.3137 72 70.84278 134.0175 73 69.92442 140.3969 74 64.28508 102.8351 75 68.2452 128.5214 76 66.35708 120.2991 77 68.36275 138.6036 78 65.4769 132.9574 79 69.71947 115.6233 80 67.72554 122.524 81 68.63941 134.6254 82 66.78405 121.8986 83 70.05147 155.3767 84 66.27848 128.9418 85 69.20198 129.1013 86 69.13481 139.4733 87 67.36436 140.8901 88 70.09297 131.5916 89 70.1766 121.1232 90 68.22556 131.5127 91 68.12932 136.5479 92 70.24256 141.4896 93 71.48752 140.6104 94 69.20477 112.1413 95 70.06306 133.457 96 70.55703 131.8001 97 66.28644 120.0285 98 63.42577 123.0972 99 66.76711 128.1432 100 68.88741 115.4759 101 64.87434 102.0927 102 67.09272 130.353 103 68.34761 134.1842 104 65.61073 98.64133 105 67.75551 114.5599 106 68.0212 123.4917 107 67.66193 123.048 108 66.3146 126.4772 109 69.43706 128.417 110 63.83624 127.1941 111 67.72277 122.0562 112 70.05098 127.6064 113 70.18602 131.6423 114 65.94588 111.8955 115 70.007 122.039 116 68.61129 128.5547 117 68.80817 132.6792 118 69.76212 136.0632 119 65.45539 115.9403 120 68.82534 136.9041 121 65.8003 119.8804 122 67.21474 109.0055 123 69.42021 128.2705 124 68.94396 135.2913 125 67.9415 106.8558 126 65.62506 123.2939 127 66.49607 109.5143 128 67.92809 119.3087 129 68.89415 140.2402 130 70.241 133.9841 131 68.26623 132.5807 132 71.23161 130.6988 133 69.09747 115.5637 134 64.39693 123.7941 135 71.09585 128.1427 136 68.21868 135.9646 137 65.91721 116.6273 138 67.4369 126.8241 139 73.90107 151.3913 140 69.98149 130.4022 141 69.51862 136.2068 142 65.18437 113.3989 143 68.00869 125.3287 144 68.3384 127.5846 145 65.18417 107.1564 146 68.26209 116.4588 147 68.56865 133.8402 148 64.49675 112.8901 149 68.71053 130.7568 150 68.89148 137.7571 151 69.54011 125.4036 152 67.39964 138.4659 153 66.47521 120.8184 154 66.01217 140.1539 155 72.44434 136.7397 156 64.12642 106.1139 157 70.98112 158.9562 158 67.50124 108.7868 159 72.01515 138.7758 160 65.31143 115.9136 161 67.07509 146.2922 162 64.39148 109.8765 163 69.37003 139.0499 164 68.37921 119.9001 165 65.31018 128.3069 166 67.1369 127.2428 167 68.39468 115.2306 168 66.2918 124.7975 169 67.1866 126.9511 170 65.99156 111.2711 171 69.43393 122.6089 172 67.97463 124.2084 173 67.76133 124.6453 174 65.27864 119.5169 175 73.83364 139.2983 176 66.81312 104.8265 177 66.89411 123.0424 178 65.73568 118.8923 179 65.98283 121.4939 180 66.58396 119.2488 181 67.11294 135.0239 182 65.87481 116.228 183 66.78067 109.1731 184 68.73577 124.2237 185 66.22666 141.1645 186 65.95968 129.1501 187 68.58372 127.8693 188 66.59347 120.9244 189 66.96574 127.6466 190 68.08015 101.4693 191 70.19025 144.9927 192 65.52149 110.9523 193 67.45905 132.8625 194 67.40985 146.3385 195 69.66158 145.5894 196 65.79799 120.8431 197 66.10558 115.7813 198 68.23987 128.3019 199 68.02403 127.4718 200 71.39044 127.8761 201 65.7316 121.4997 202 66.43358 112.7148 203 70.01309 135.002 204 69.48146 128.6789 205 68.62764 124.4062 206 68.36275 140.026 207 68.39028 117.519 208 68.77413 143.8737 209 69.9236 141.1703 210 71.55542 155.9414 211 68.44764 134.0093 212 66.71398 130.0975 213 66.68413 106.2265 214 67.93699 112.0489 215 68.89855 136.1884 216 67.29191 131.236 217 69.57212 131.3231 218 67.67479 119.5261 219 69.04155 116.9965 220 67.96765 138.5255 221 65.83982 109.6518 222 65.77288 130.1569 223 71.14106 137.1114 224 67.83055 113.759 225 65.0693 114.9725 226 69.70745 127.7149 227 69.92983 121.9972 228 66.11569 117.9607 229 68.61364 127.7141 230 68.9976 117.9619 231 66.79171 125.1554 232 68.02363 141.1026 233 69.67258 145.4822 234 71.82178 116.065 235 72.74676 135.7458 236 67.27951 132.9248 237 67.41015 115.6622 238 68.5315 114.3184 239 68.47126 148.952 240 68.51867 142.1878 241 63.72529 134.104 242 67.70483 141.8926 243 69.47115 138.7444 244 66.70198 134.449 245 65.23126 117.0167 246 69.89473 115.6752 247 69.83048 134.7905 248 65.3979 120.5746 249 68.32214 120.0835 250 65.93895 84.3598
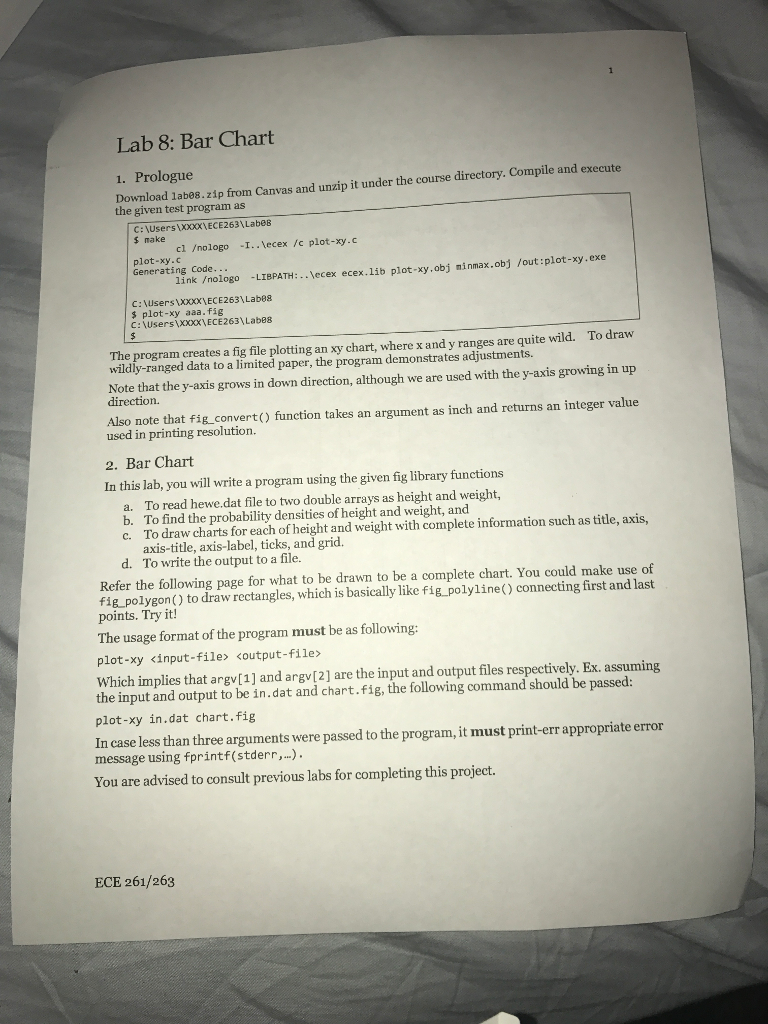
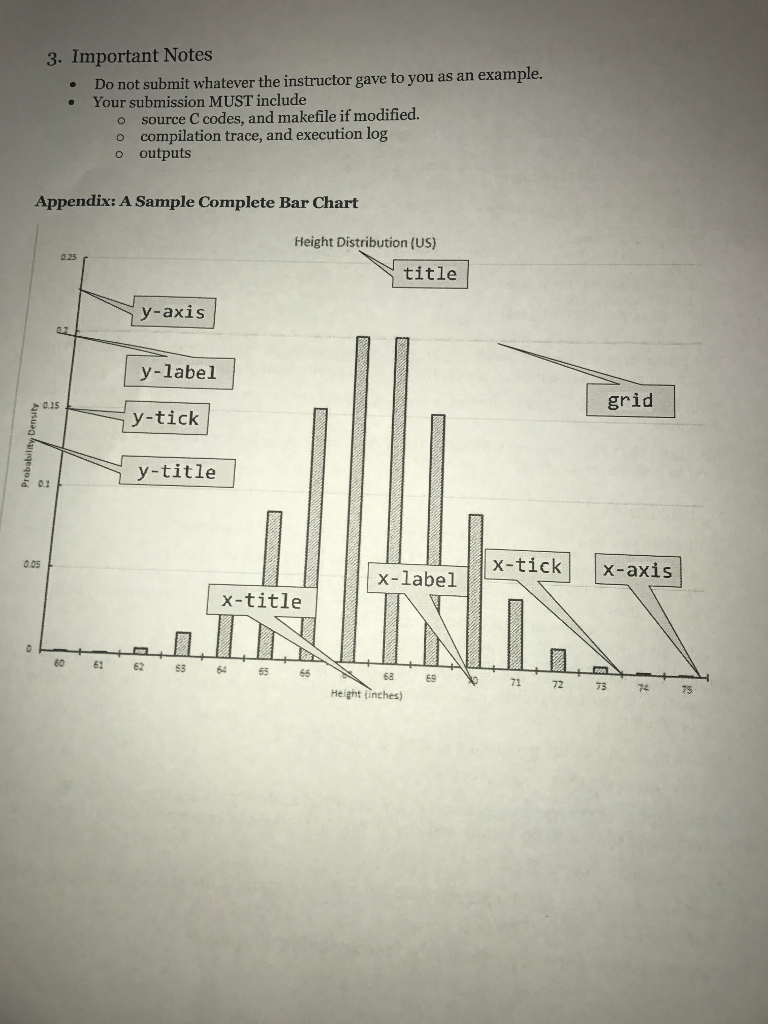
Lab 8: Bar Chart 1. Prologue Downlond labesip from Canvas and unzip it under the course directory. Compile and execute the given test program as C: \Users XXXX\ECE263\ Labe8 $ make c1 ologo -1.. ecex /c plot-xy-c plot-xy. Generating Code link ologo -LIBPATH:..lecex ecex.lib plot-xy.obj ninmax.obj /out:plot-xy.exe C:\Users Xxxx\ECE263\ Lab88 $ plot-xy aaa.fig C:\UsersXXXXECE263\ Labe8 To draw The program creates a fig file plotting an xy chart, where x and y ranges are quite wild. wildly-ranged data to a limited paper, the program demonstrates adjustments. Note that the y-axis grows in down direction, although we are used with the y-axis growing in up direction Also note that fig.convert) function takes an argument as inch and returns an integer value used in printing resolution 2. Bar Chart In this lab, you will write a program using the given fig library functions a. To read hewe.dat file to two double arrays as height and weight, b. c. To find the probability densities of height and weight, and To draw charts for each of height and weight with complete information such as title, axis, axis-title, axis-label, ticks, and grid. d. To write the output to a file. Refer the following page for what to be drawn to be a complete chart. You could make use of fig_polygon() to draw rectangles, which is basically like figpolyline() connecting first and last points. Try it! The usage format of the program must be as following: plot-xy
Step by Step Solution
There are 3 Steps involved in it

Get step-by-step solutions from verified subject matter experts