

Question: So I am coding in R (using ggplot2) and I am trying to change my bar graph so when the mean(epa) is below 0 the
So I am coding in R (using ggplot2) and I am trying to change my bar graph so when the mean(epa) is below 0 the bar will be red and when it's above 0, it will be green. I know my indexing is messed up and I'll mess with that another time but this gives me the output I want aside from the bar colors. A link to resources to help would be okay if you can't write the code given what I have posted here.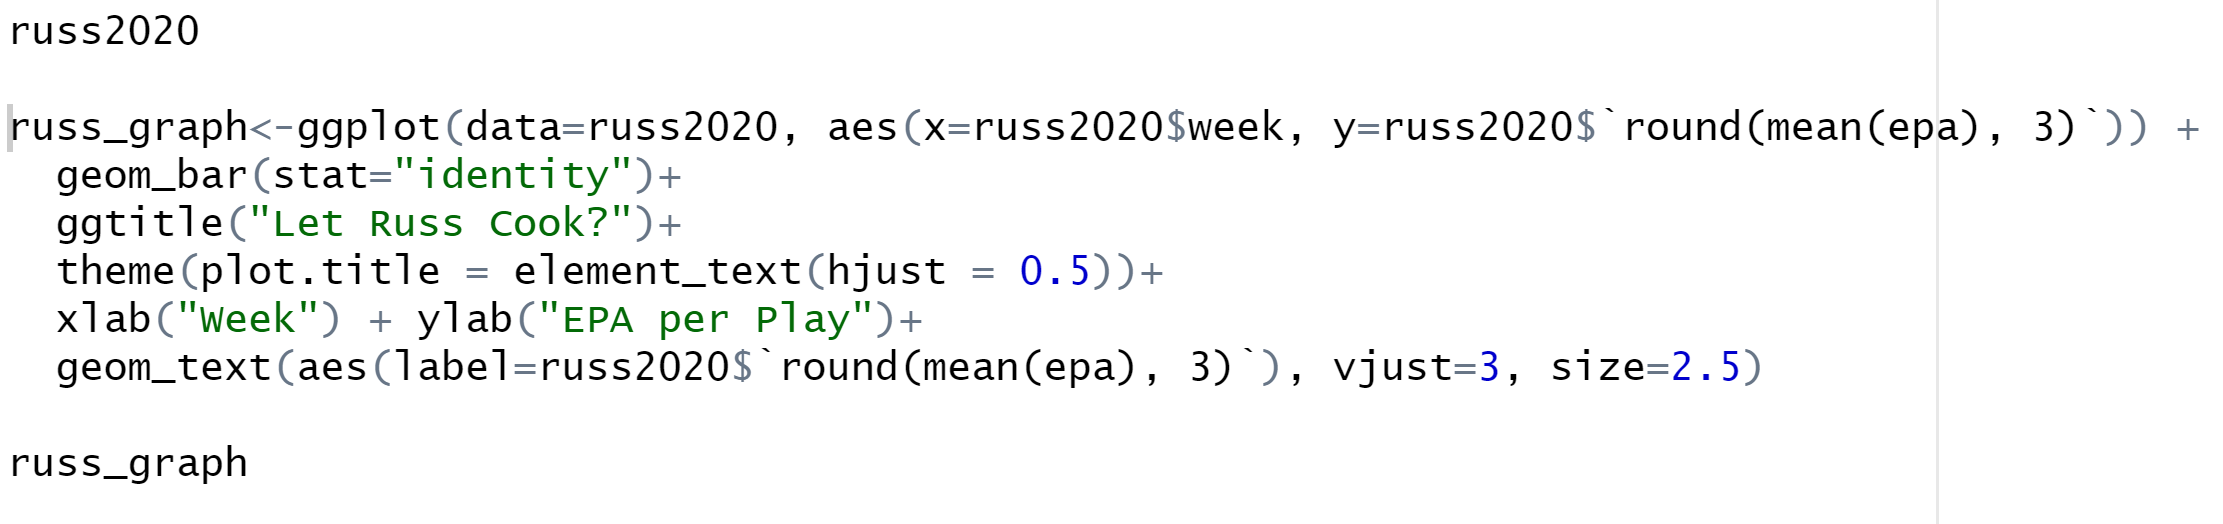
russ2020 russ_graph
Step by Step Solution
There are 3 Steps involved in it
1 Expert Approved Answer
Step: 1 Unlock

Question Has Been Solved by an Expert!
Get step-by-step solutions from verified subject matter experts
Step: 2 Unlock
Step: 3 Unlock