

Question: So I am working on this problem... I set up an excel spreadsheet with 24 random numbers using this cell equation =NORMINV(RAND(),250,40) and then I
So I am working on this problem...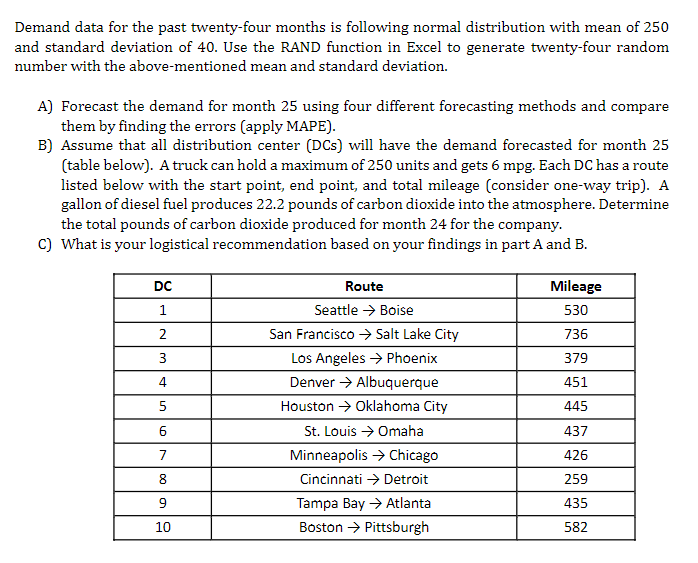
I set up an excel spreadsheet with 24 random numbers using this cell equation =NORMINV(RAND(),250,40) and then I dragged it down the column so I had 24 numbers. I am having some trouble trying to figure out how to do the various forecasting methods and could use some guidance.
Demand data for the past twenty-four months is following normal distribution with mean of 250 and standard deviation of 40. Use the RAND function in Excel to generate twenty-four random number with the above-mentioned mean and standard deviation. A) Forecast the demand for month 25 using four different forecasting methods and compare them by finding the errors (apply MAPE). B) Assume that all distribution center (DCs) will have the demand forecasted for month 25 (table below). A truck can hold a maximum of 250 units and gets 6 mpg. Each DC has a route listed below with the start point, end point, and total mileage (consider one-way trip). A gallon of diesel fuel produces 22.2 pounds of carbon dioxide into the atmosphere. Determine the total pounds of carbon dioxide produced for month 24 for the company. C) What is your logistical recommendation based on your findings in part A and B. DC 1 Mileage 530 736 379 2 3 3 4 451 5 Route Seattle Boise San Francisco Salt Lake City Los Angeles Phoenix Denver Albuquerque Houston Oklahoma City St. Louis Omaha Minneapolis Chicago Cincinnati Detroit Tampa Bay Atlanta Boston Pittsburgh 445 6 7 8 437 426 259 435 582 9 10 Demand data for the past twenty-four months is following normal distribution with mean of 250 and standard deviation of 40. Use the RAND function in Excel to generate twenty-four random number with the above-mentioned mean and standard deviation. A) Forecast the demand for month 25 using four different forecasting methods and compare them by finding the errors (apply MAPE). B) Assume that all distribution center (DCs) will have the demand forecasted for month 25 (table below). A truck can hold a maximum of 250 units and gets 6 mpg. Each DC has a route listed below with the start point, end point, and total mileage (consider one-way trip). A gallon of diesel fuel produces 22.2 pounds of carbon dioxide into the atmosphere. Determine the total pounds of carbon dioxide produced for month 24 for the company. C) What is your logistical recommendation based on your findings in part A and B. DC 1 Mileage 530 736 379 2 3 3 4 451 5 Route Seattle Boise San Francisco Salt Lake City Los Angeles Phoenix Denver Albuquerque Houston Oklahoma City St. Louis Omaha Minneapolis Chicago Cincinnati Detroit Tampa Bay Atlanta Boston Pittsburgh 445 6 7 8 437 426 259 435 582 9 10Step by Step Solution
There are 3 Steps involved in it
1 Expert Approved Answer
Step: 1 Unlock

Question Has Been Solved by an Expert!
Get step-by-step solutions from verified subject matter experts
Step: 2 Unlock
Step: 3 Unlock