

Question: Social Science Statistics Fall 2022 Homework #8 Dr. Hitlan Name Multiple Choice (1-point each) 1. A hypothesis test is a. a descriptive technique that allows
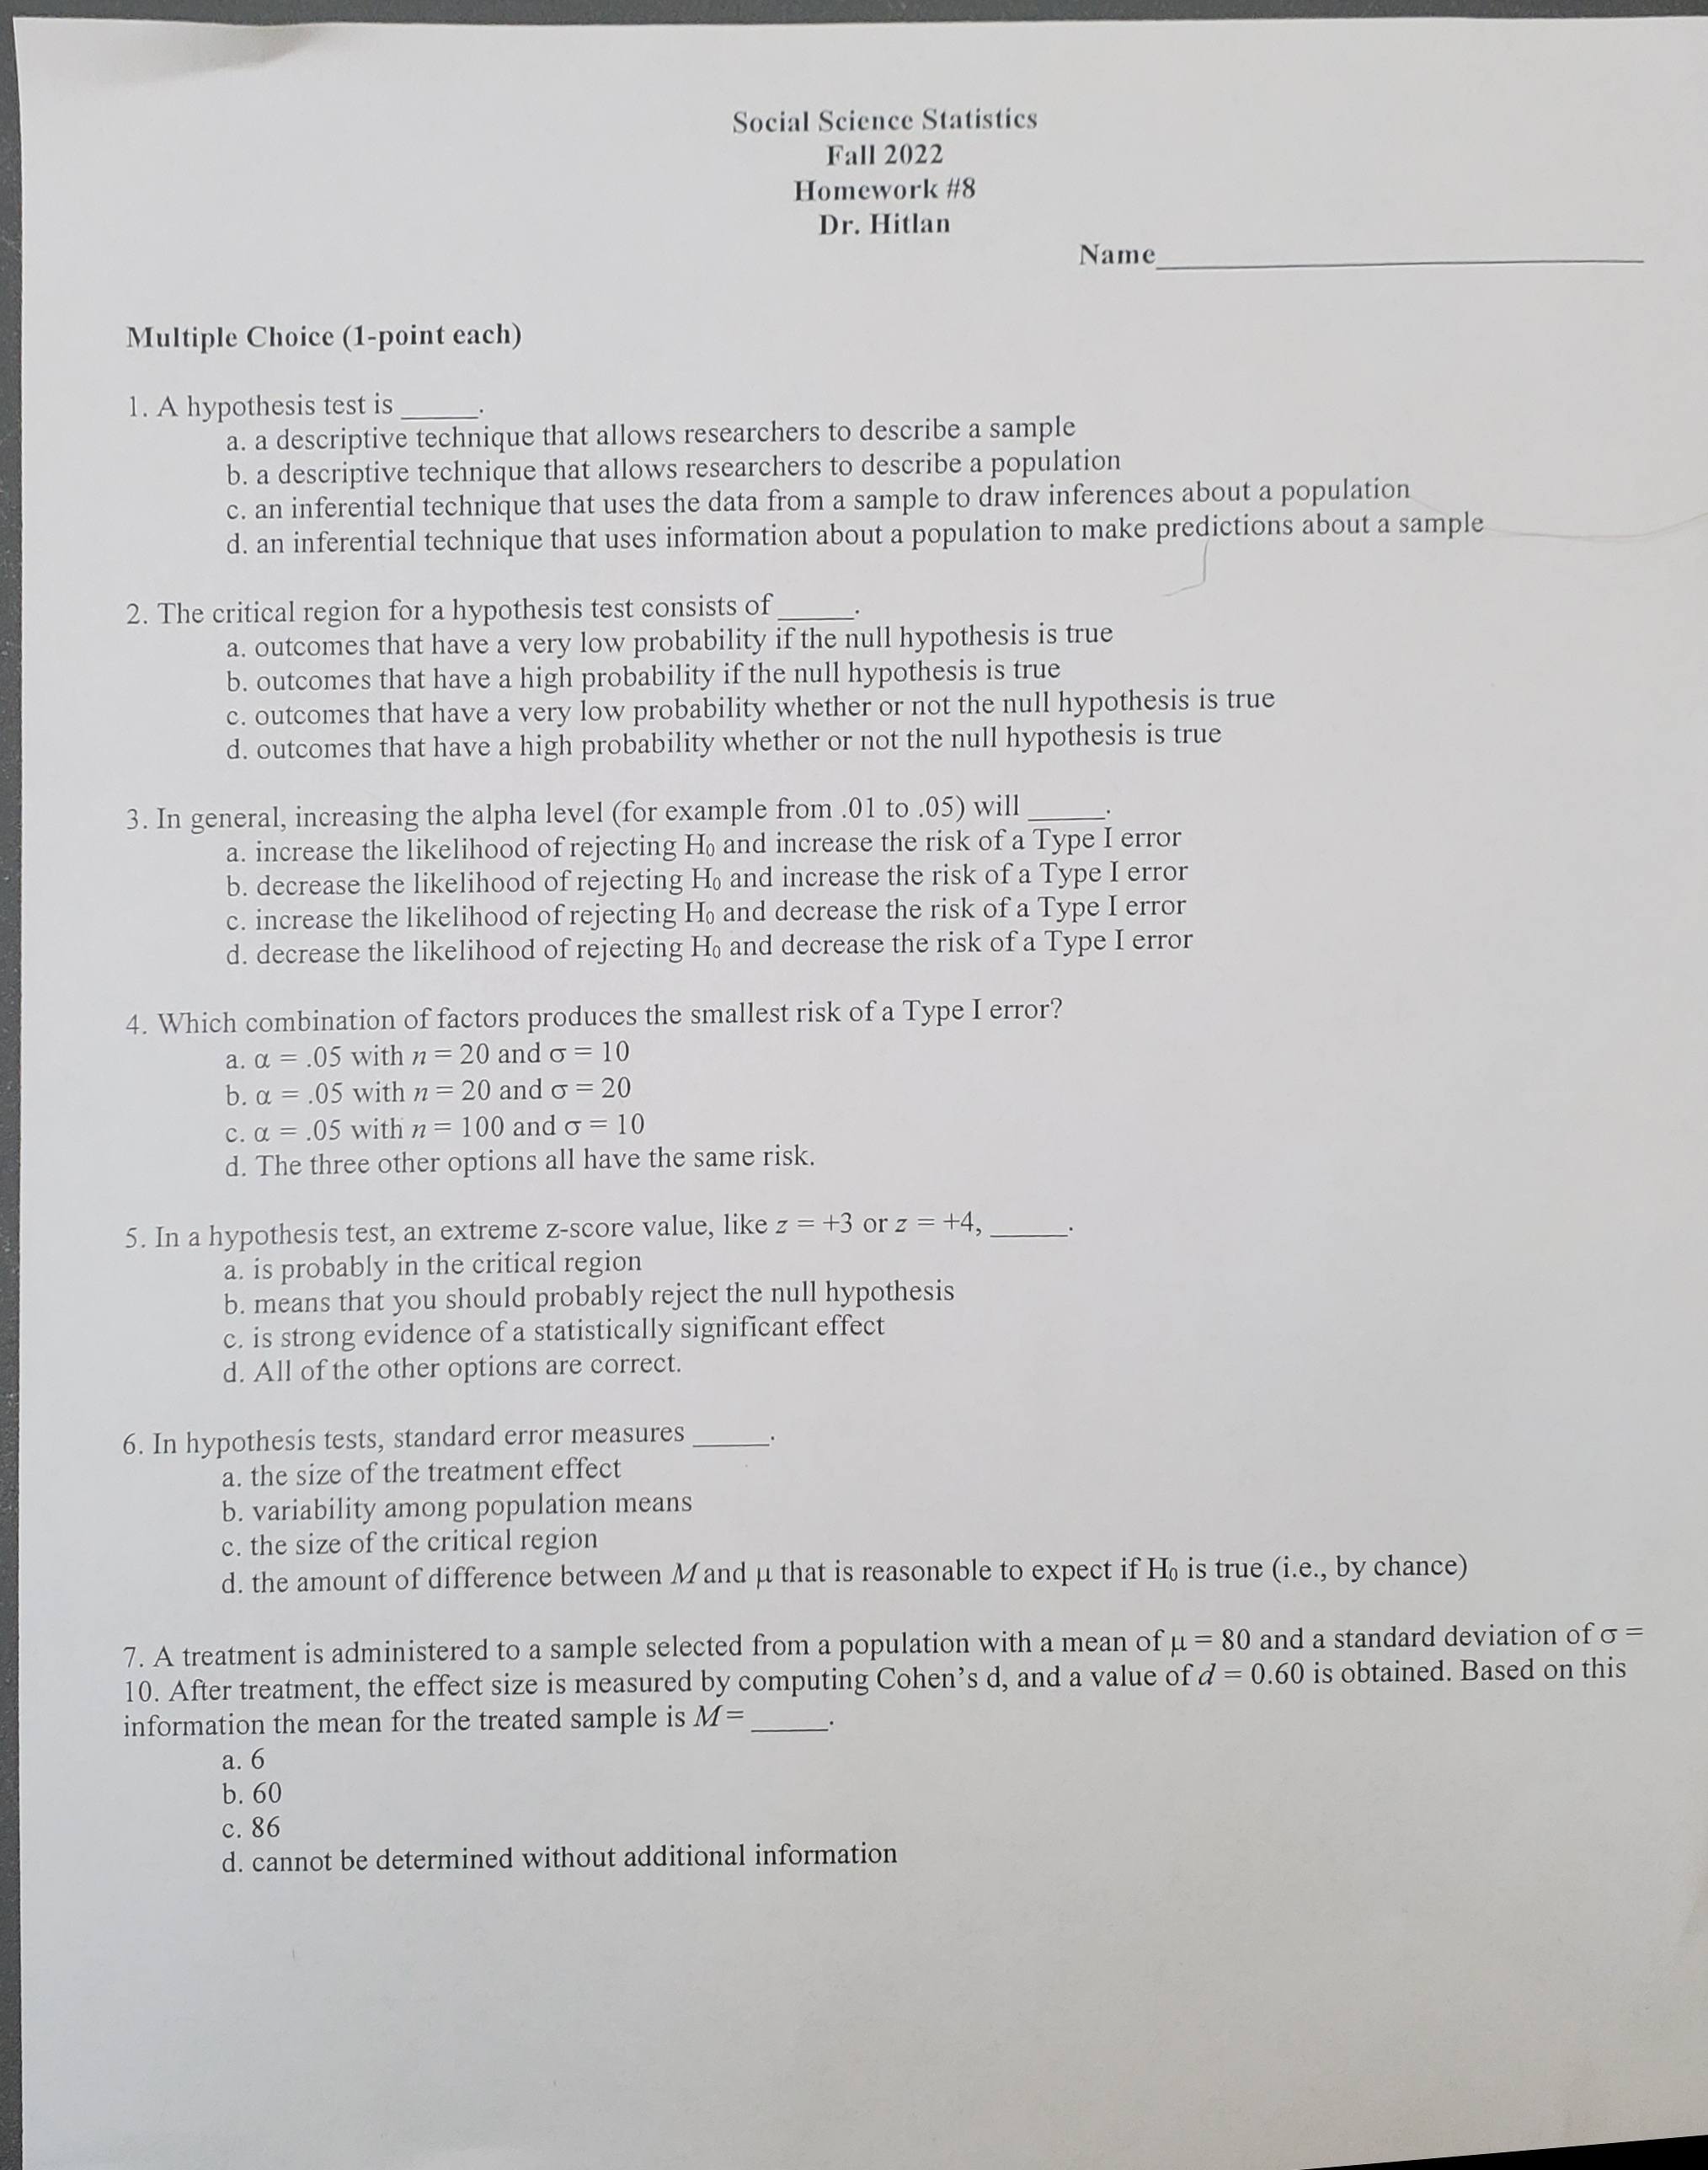
Social Science Statistics Fall 2022 Homework #8 Dr. Hitlan Name Multiple Choice (1-point each) 1. A hypothesis test is a. a descriptive technique that allows researchers to describe a sample b. a descriptive technique that allows researchers to describe a population c. an inferential technique that uses the data from a sample to draw inferences about a population d. an inferential technique that uses information about a population to make predictions about a sample 2. The critical region for a hypothesis test consists of a. outcomes that have a very low probability if the null hypothesis is true b. outcomes that have a high probability if the null hypothesis is true c. outcomes that have a very low probability whether or not the null hypothesis is true d. outcomes that have a high probability whether or not the null hypothesis is true 3. In general, increasing the alpha level (for example from .01 to .05) will a. increase the likelihood of rejecting Ho and increase the risk of a Type I error b. decrease the likelihood of rejecting Ho and increase the risk of a Type I error c. increase the likelihood of rejecting Ho and decrease the risk of a Type I error d. decrease the likelihood of rejecting Ho and decrease the risk of a Type I error 4. Which combination of factors produces the smallest risk of a Type I error? a. a = .05 with n = 20 and o = 10 b. a = .05 with n = 20 and o = 20 c. a = .05 with n = 100 and o = 10 d. The three other options all have the same risk. 5. In a hypothesis test, an extreme z-score value, like z = +3 or z = +4, a. is probably in the critical region b. means that you should probably reject the null hypothesis c. is strong evidence of a statistically significant effect d. All of the other options are correct. 6. In hypothesis tests, standard error measures a. the size of the treatment effect b. variability among population means c. the size of the critical region d. the amount of difference between M and u that is reasonable to expect if Ho is true (i.e., by chance) 7. A treatment is administered to a sample selected from a population with a mean of u = 80 and a standard deviation of o = 10. After treatment, the effect size is measured by computing Cohen's d, and a value of d = 0.60 is obtained. Based on this information the mean for the treated sample is M= a. 6 b. 60 C. 86 d. cannot be determined without additional information
Step by Step Solution
There are 3 Steps involved in it

Get step-by-step solutions from verified subject matter experts