

Question: Software upgrade times(in seconds) are being evaluated. Samples of five observations have been taken at each inspection and the results are listed. a. Using
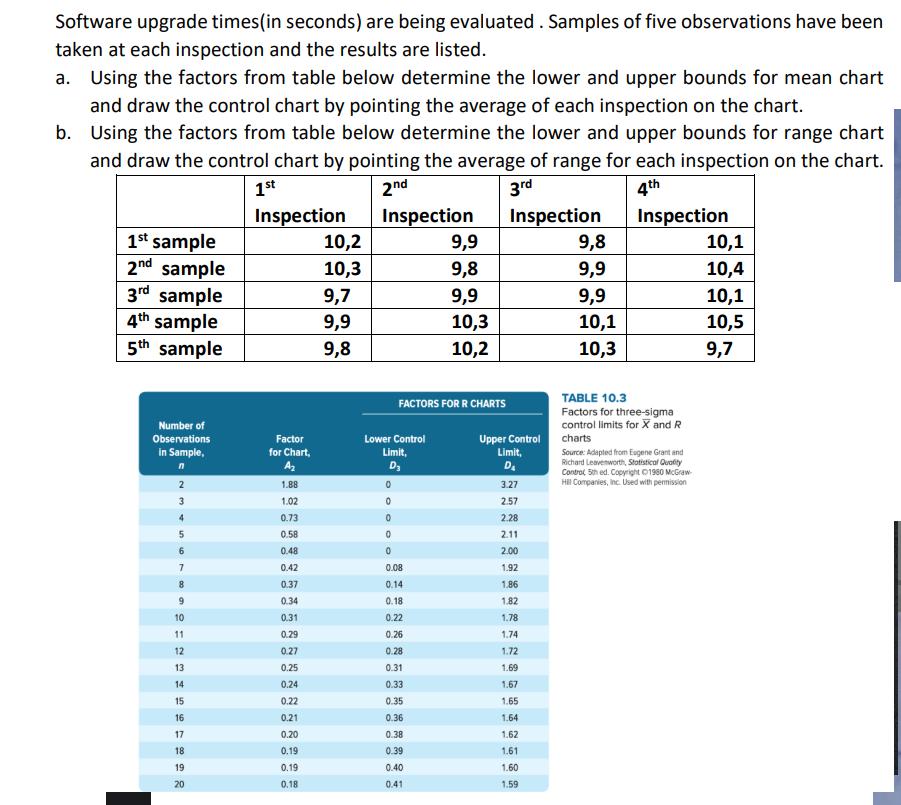
Software upgrade times(in seconds) are being evaluated. Samples of five observations have been taken at each inspection and the results are listed. a. Using the factors from table below determine the lower and upper bounds for mean chart and draw the control chart by pointing the average of each inspection on the chart. b. Using the factors from table below determine the lower and upper bounds for range chart and draw the control chart by pointing the average of range for each inspection on the chart. 1st 3rd 4th 2nd Inspection Inspection Inspection Inspection 9,9 9,8 9,8 9,9 9,9 9,9 10,3 10,1 10,2 10,3 1st sample 2nd sample 3rd sample 4th sample 5th sample Number of Observations in Sample, n 2 3 4 5 6 7 8 9 10 11 12 13 14 15 16 17 18 19 20 Factor for Chart, A 1.88 1.02 0.73 0.58 0.48 0.42 0.37 0.34 0.31 0.29 0.27 0.25 0.24 0.22 0.21 0.20 0.19 0.19 0.18 10,2 10,3 9,7 9,9 9,8 FACTORS FOR R CHARTS Lower Control Limit, D3 0 0 0 0 0 0.08 0.14 0.18 0.22 0.26 0.28 0.31 0.33 0.35 0.36 0.38 0.39 0.40 0.41 Upper Control Limit, D 3.27 2.57 2.28 2.11 2.00 1.92 1.86 1.82 1.78 1.74 1.72 1.69 1.67 1.65 1.64 1.62 1.61 1.60 1.59 TABLE 10.3 Factors for three-sigma control limits for X and R charts Source: Adapted from Eugene Grant and Richard Leavenworth, Statistical Quality Control 5th ed. Copyright 1960 McGraw- Hill Companies, Inc. Used with permission 10,1 10,4 10,1 10,5 9,7
Step by Step Solution
3.50 Rating (163 Votes )
There are 3 Steps involved in it
These charts are used to monitor the process to see i... View full answer

Get step-by-step solutions from verified subject matter experts