

Question: Solid Chemical Engineering Create energy level diagram for Cu using the above tables. also find the range of em spectrum does this level lie. VALUES
Solid Chemical Engineering
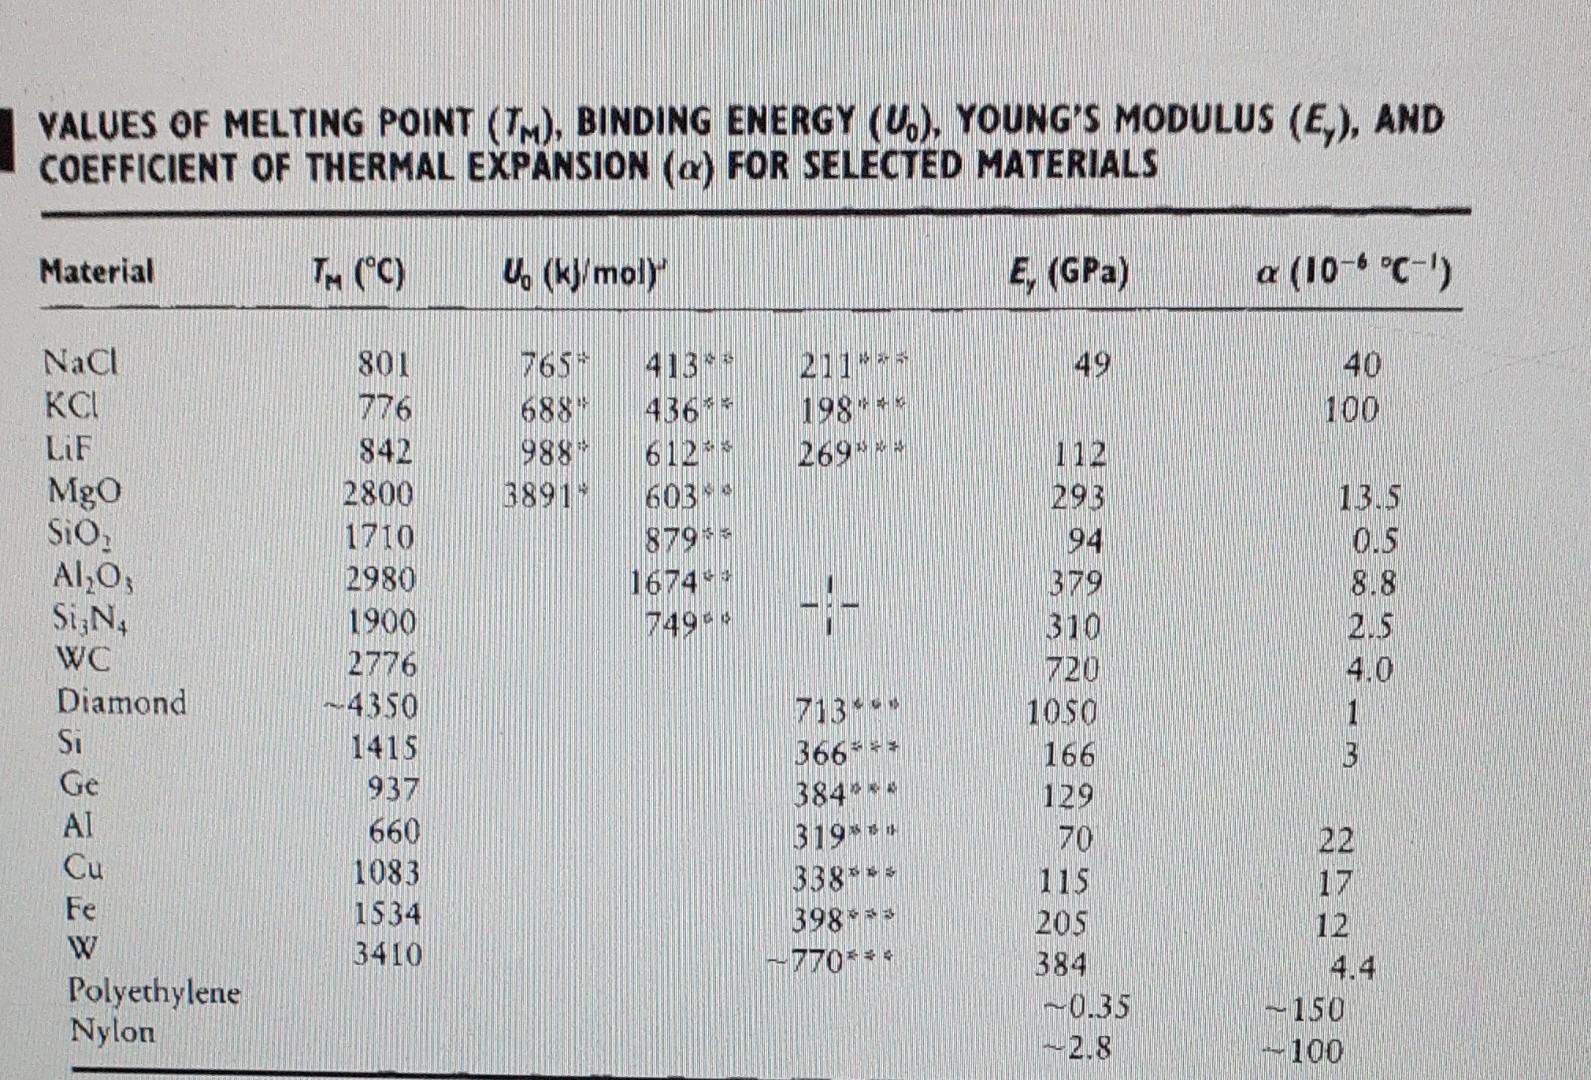
Create energy level diagram for Cu using the above tables. also find the range of em spectrum does this level lie.
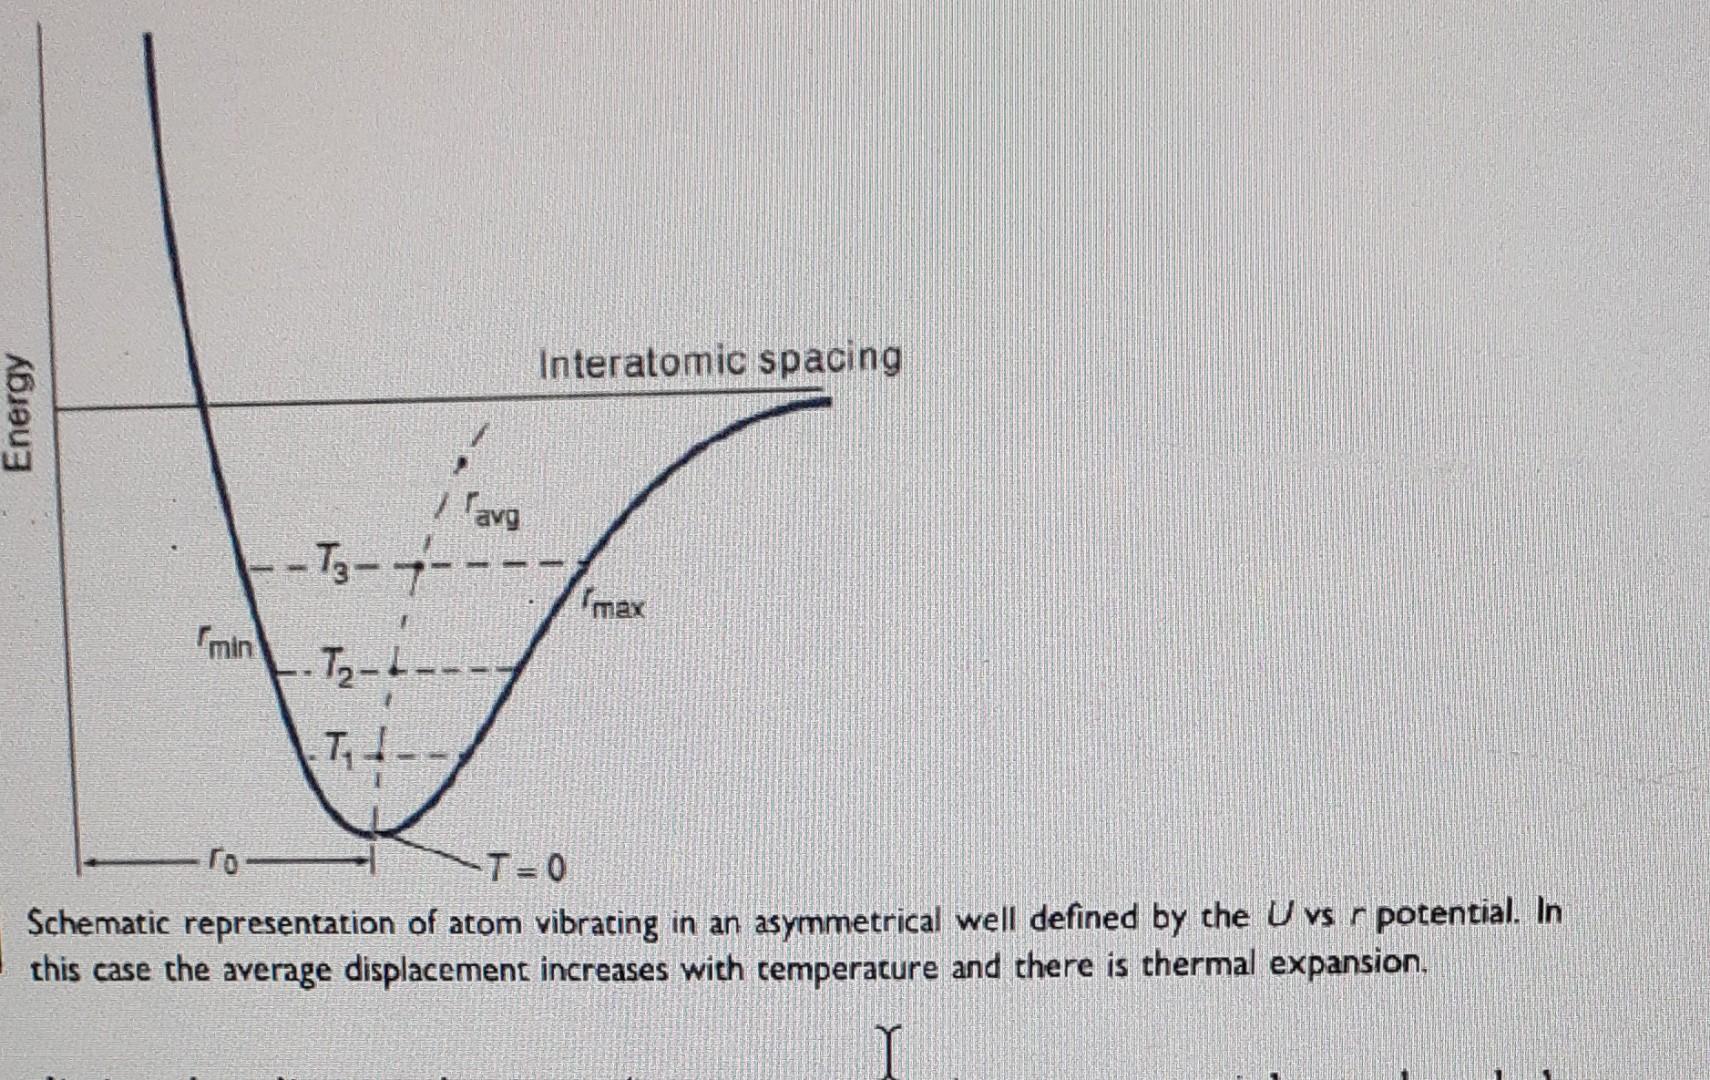
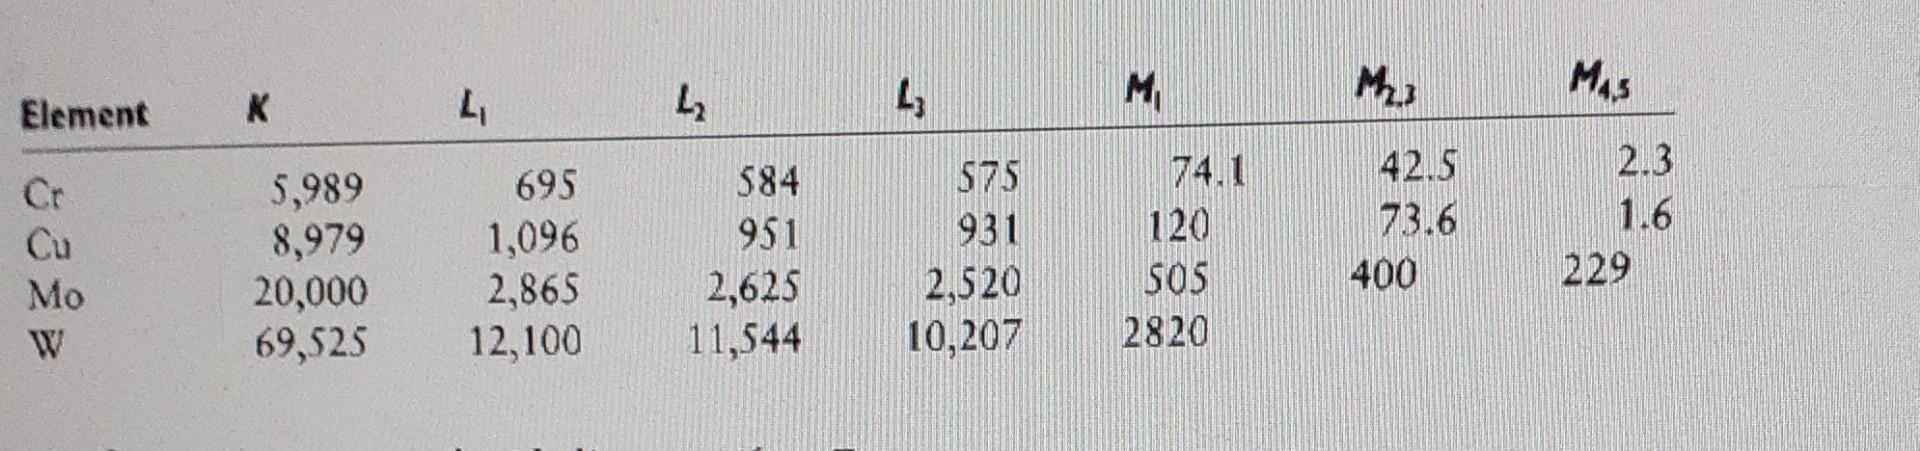
VALUES OF MELTING POINT (TM), BINDING ENERGY (U.). YOUNG'S MODULUS (E), AND COEFFICIENT OF THERMAL EXPANSION (a) FOR SELECTED MATERIALS Material TM (C) U (kJ/moly E, (GPa) a (10-6 C-') 49 765 688 1988 8891 211 1981 269 40 100 413 4360 612 603 8790 167447 74943 NaCl LiF Mgo SIO AlO; Si N WC Diamond Si Ge Cu Fe W Polyethylene Nylon 801 776 842 2800 1710 2980 1900 2776 2.4350 1415 937 660 1083 1534 3410 13.5 0.5 8.8 20.5 4.0 112 293 94 379 310 720 1050 166 129 70 115 205 384 ~0.35 -- 2.8 7134 366*** 384*** 319*** 3388 39813 -770*** w- 22 17 12 4.4 -150 100 Interatomic spacing Energy avg T3-7- max min ..Tz-1 T, ro -T=0 Schematic representation of atom vibracing in an asymmetrical well defined by the Uvs r potential . In this case the average displacement increases with cemperature and there is thermal expansion, Element M M MAS L L L K Cr 5,989 8,979 20,000 69,525 695 1,096 2,865 12,100 Cu Mo W 584 951 2,625 11,544 575 931 2,520 10,207 74.1 120 SOS 2820 42.5 73.6 400 213 1.6 229
Step by Step Solution
There are 3 Steps involved in it

Get step-by-step solutions from verified subject matter experts