

Question: Solution by hand step by step without integration if it available. Given the acceleration pattern shown in Fig. below, ( a ) derive and plot
Solution by hand step by step without integration if it available.
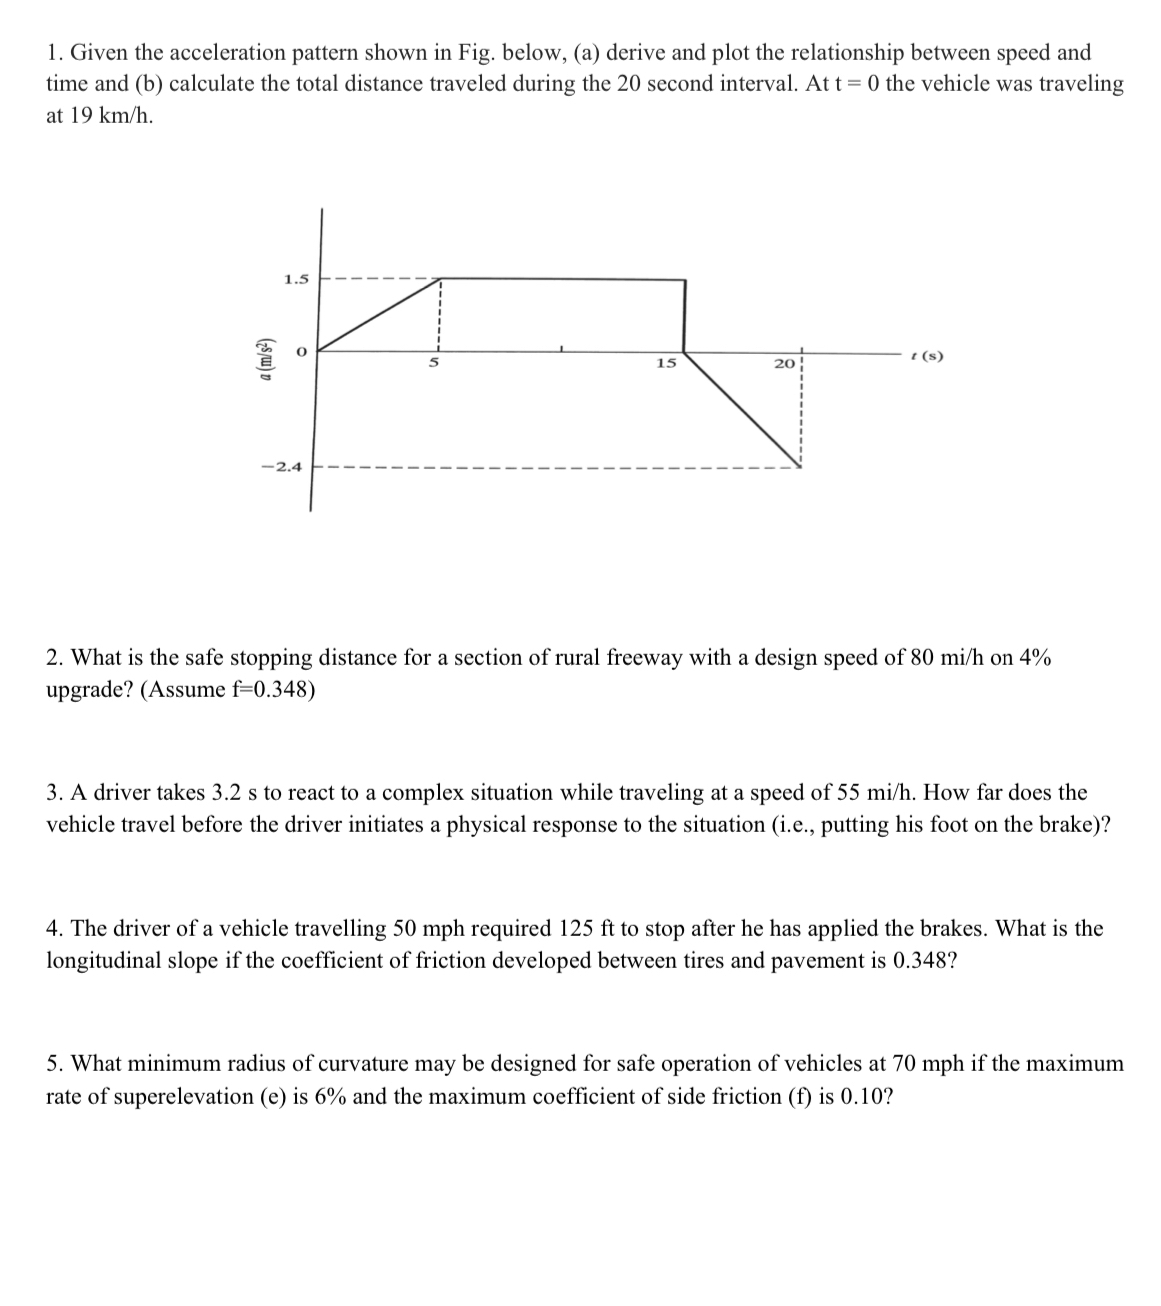
Given the acceleration pattern shown in Fig. below, a derive and plot the relationship between speed and
time and b calculate the total distance traveled during the second interval. At the vehicle was traveling
at
What is the safe stopping distance for a section of rural freeway with a design speed of
upgrade? Assume
A driver takes s to react to a complex situation while traveling at a speed of How far does the
vehicle travel before the driver initiates a physical response to the situation ie putting his foot on the brake
The driver of a vehicle travelling mph required ft to stop after he has applied the brakes. What is the
longitudinal slope if the coefficient of friction developed between tires and pavement is
What minimum radius of curvature may be designed for safe operation of vehicles at mph if the maximum
rate of superelevation e is and the maximum coefficient of side friction f is
Step by Step Solution
There are 3 Steps involved in it
1 Expert Approved Answer
Step: 1 Unlock

Question Has Been Solved by an Expert!
Get step-by-step solutions from verified subject matter experts
Step: 2 Unlock
Step: 3 Unlock