

Question: SOLUTION TO THE SECOND PROBLEM ONLY REQUIRED ( USE MATLAB CODE ONLY ) 1) For the continuous time signal x(t) given below, draw x(t-4), x(t+1),
SOLUTION TO THE SECOND PROBLEM ONLY REQUIRED ( USE MATLAB CODE ONLY )
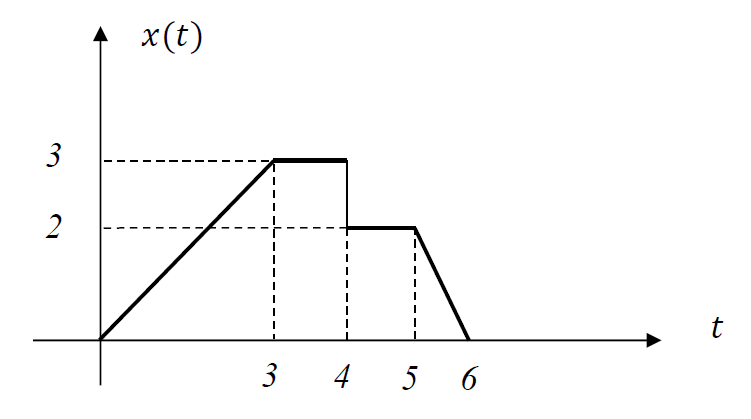
1) For the continuous time signal x(t) given below, draw x(t-4), x(t+1), x(3t), x(t/2), and 2x(t) +1 signals.
2)
a) Draw a given signal in MATLAB following these steps:
Time samples vector: >>t=0:0.1:10;
Generate the samples of a desired signal >>x=t.*exp(-t);
Draw x(t) as a function of t as >>plot(t,x)
You may enter the labels for axes as >> grid on; >> xlabel(t [Time]); >> ylabel(x(t) [Amplitude]); >> title(Plot of x(t));
b) A pulse between 0 and 10 may be generated by >>a=ones(1,10); >>b=2*ones(1,10); A ramp function may be obtained by >> t=0:10; >> c=t+2; You can append these vexctors as >>d=[a b c];
Now, generate the samples of x(t) in question 1 in MATLAB and draw it.
You may save your workspace by example
>>example1.txt
To stop it use diary off, to start again, use diary on You may edit the txt file later and add comment line as >> % this is a comment line.
X(t) 3 2 I t 3 4 5 6
Step by Step Solution
There are 3 Steps involved in it

Get step-by-step solutions from verified subject matter experts