

Question: Solution using Python Exercise 2.1: Plot the graph for the other columns and explain your findings below: [ begin{array}{l} text { sns.boxplot ( } x=text
 Solution using Python
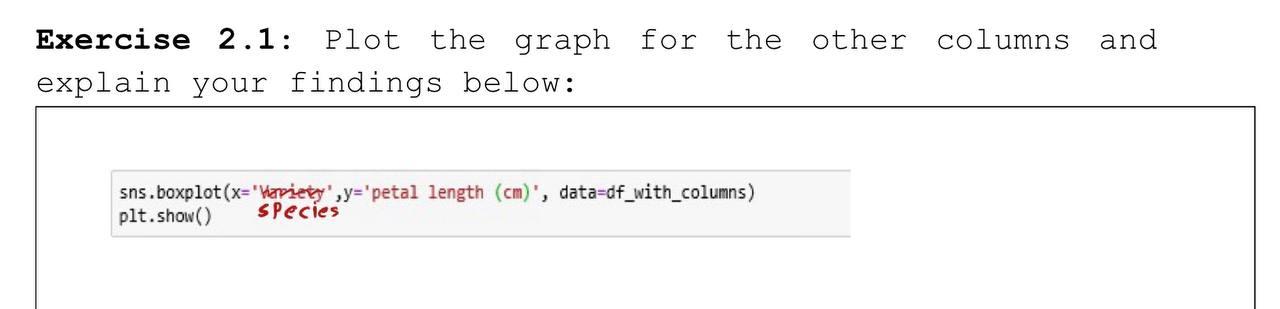
Exercise 2.1: Plot the graph for the other columns and explain your findings below: \[ \begin{array}{l} \text { sns.boxplot ( } x=\text { 'Haplety', } y=\text { 'petal length }(\mathrm{cm})^{\prime} \text {, data=df_with_columns) } \\ \text { plt.show() SPecies' } \end{array} \]
Step by Step Solution
There are 3 Steps involved in it
1 Expert Approved Answer
Step: 1 Unlock

Question Has Been Solved by an Expert!
Get step-by-step solutions from verified subject matter experts
Step: 2 Unlock
Step: 3 Unlock