

Question: Solve 1a and 1b, 2a - 2d, and 3a - 3b. please show work for equations. 9:117 LTE O Back Excel Homework #4.docx G Excel
Solve 1a and 1b, 2a - 2d, and 3a - 3b. please show work for equations.
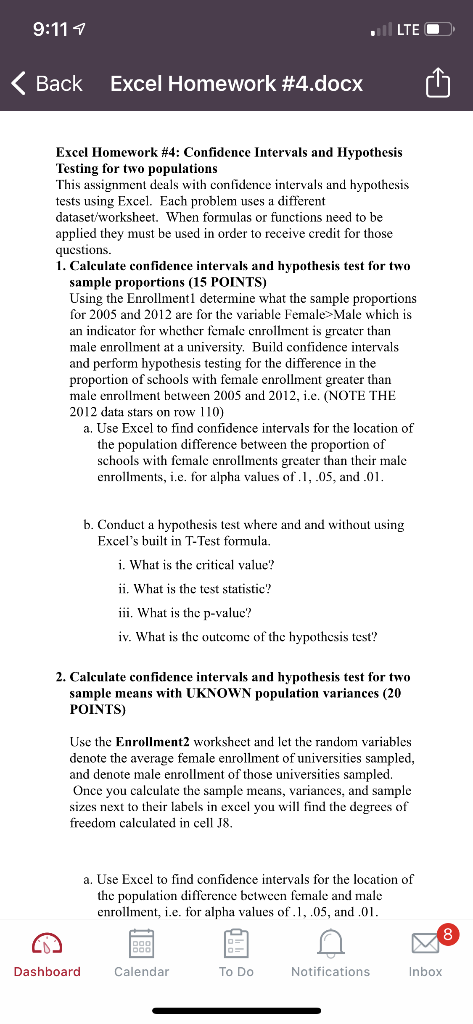
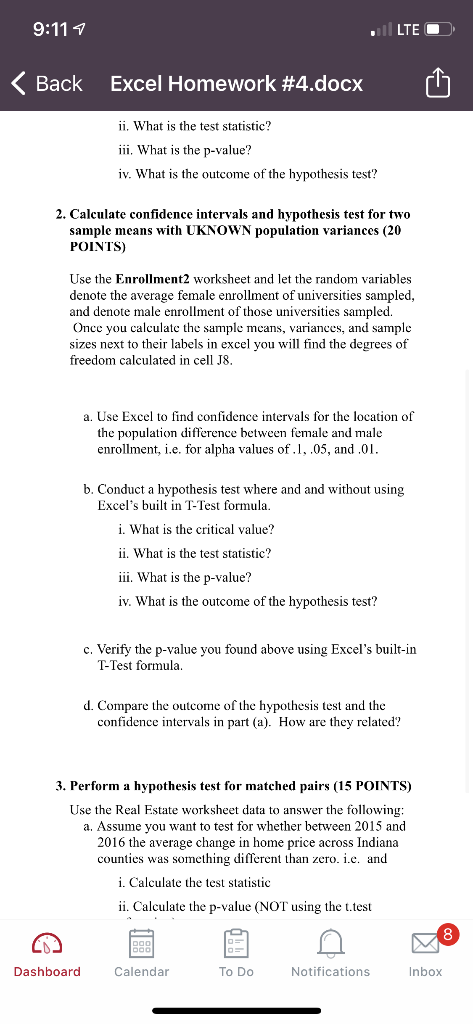
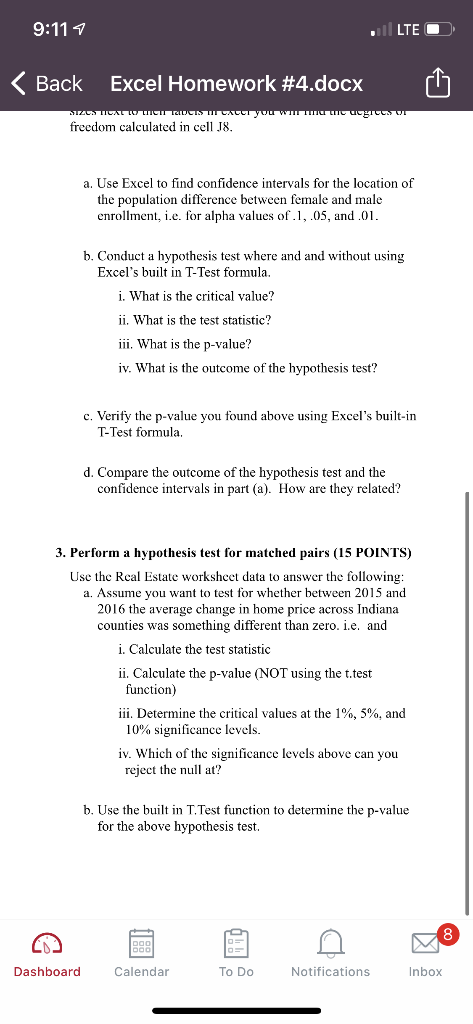
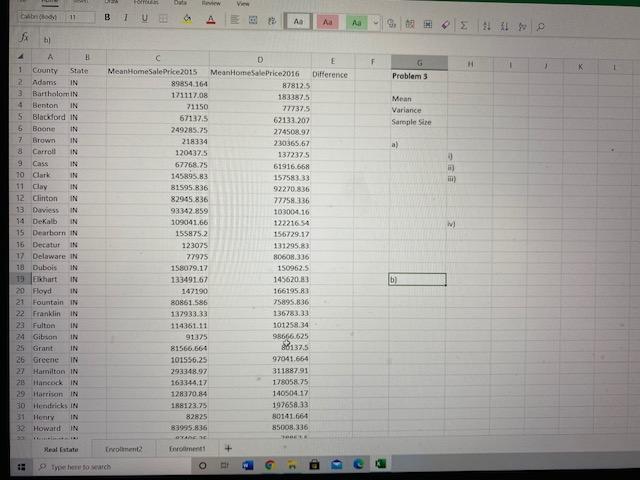
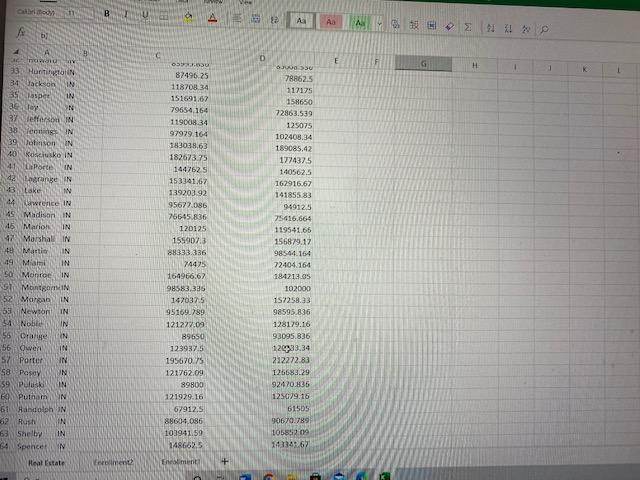
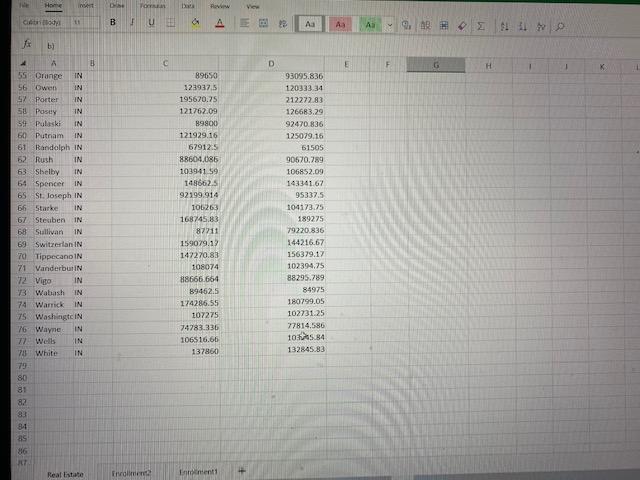
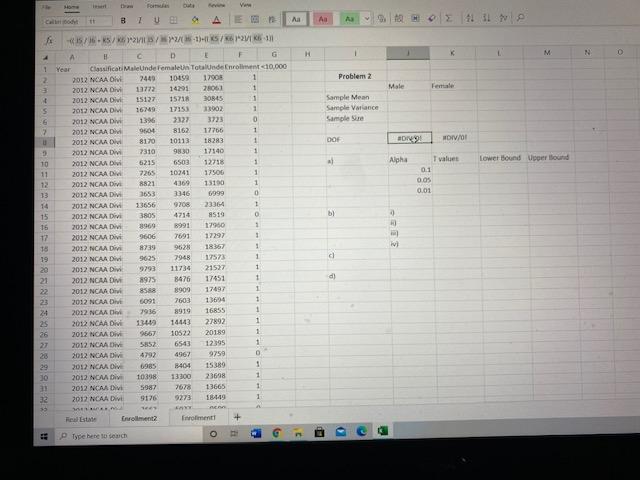
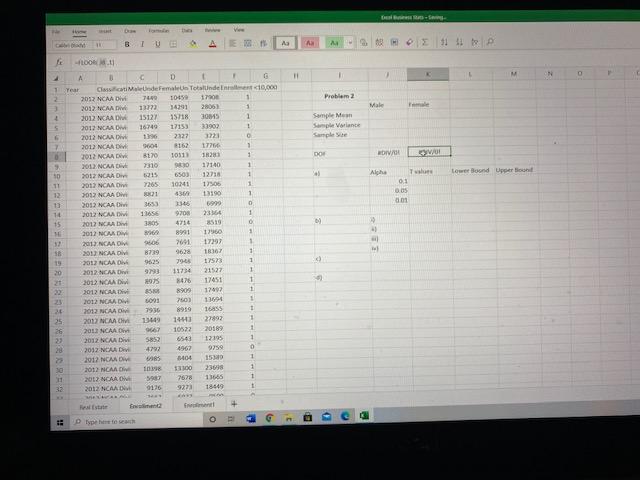
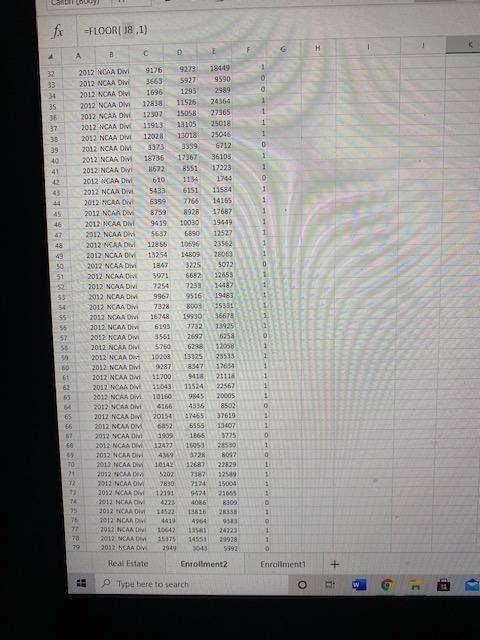
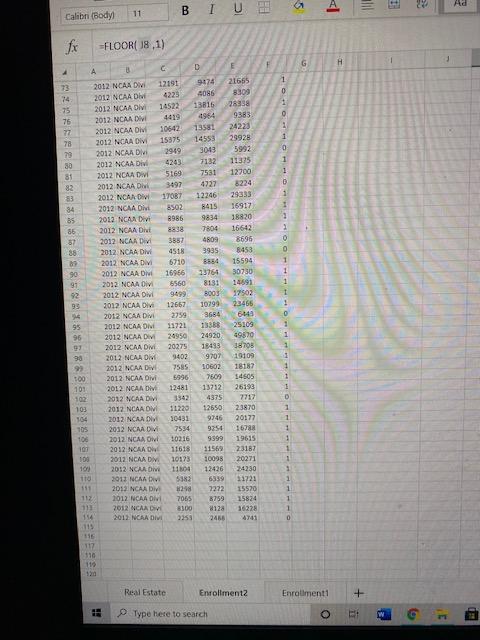
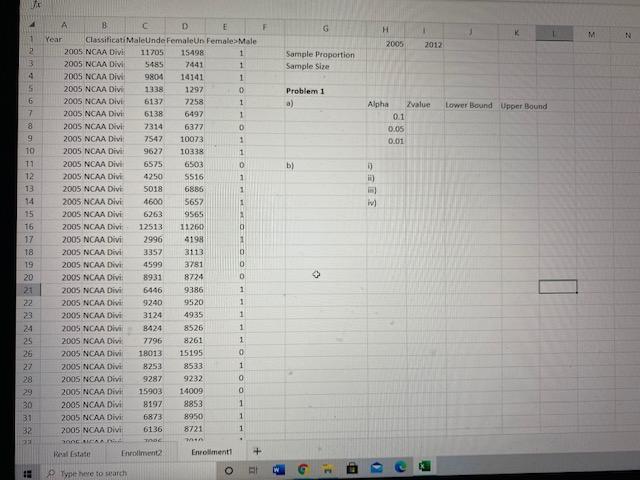
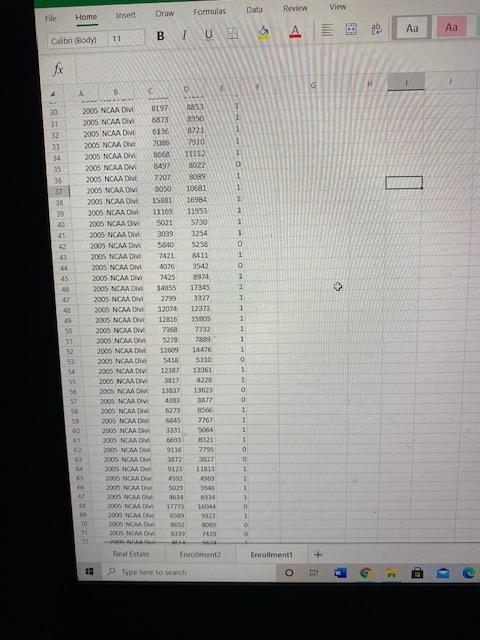
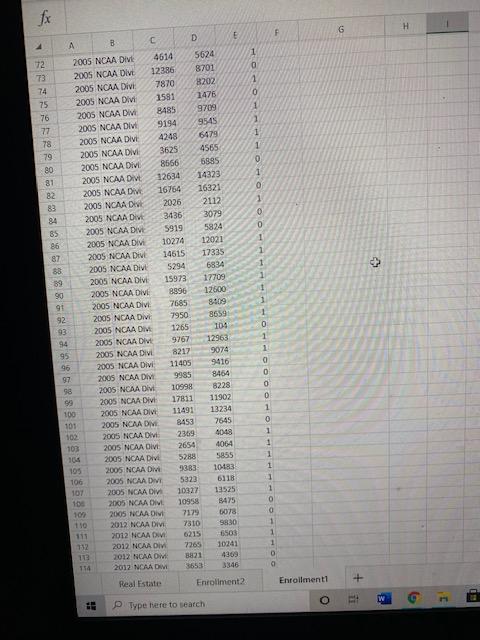
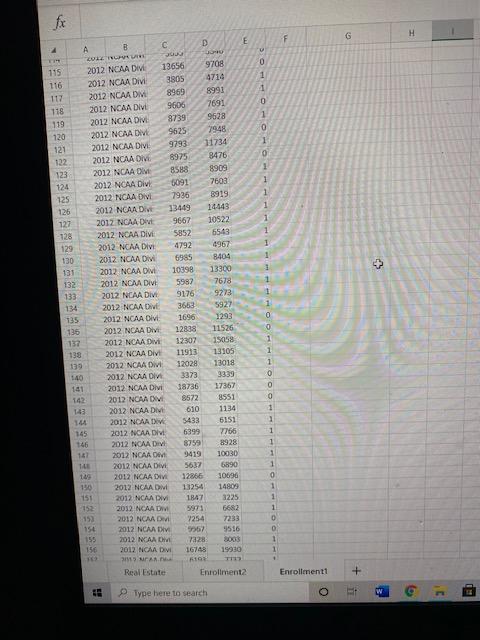
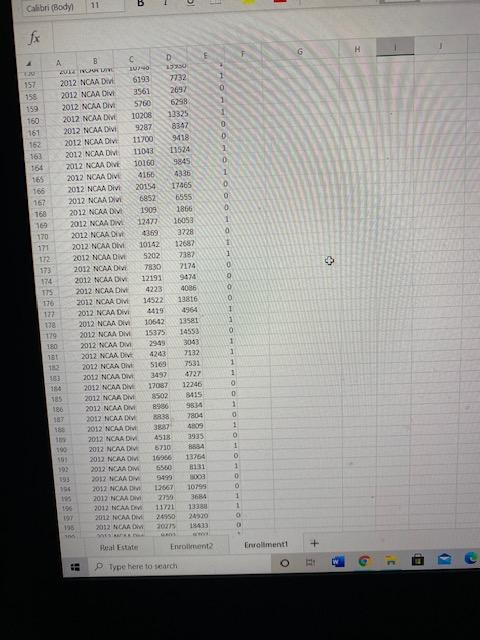
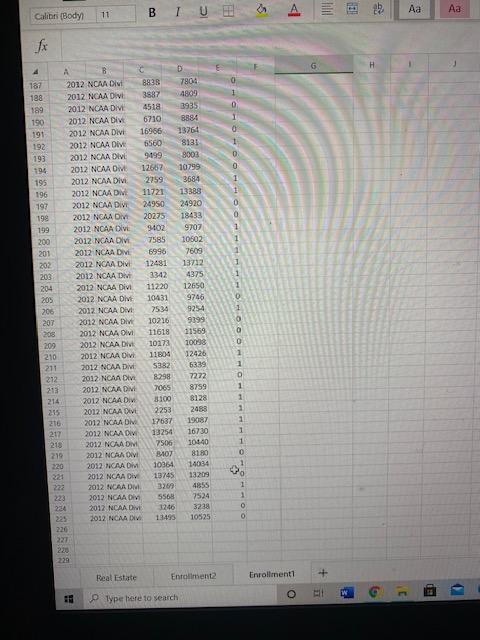
9:117 LTE O Back Excel Homework #4.docx G Excel Homework #4: Confidence Intervals and Hypothesis Testing for two populations This assignment deals with confidence intervals and hypothesis tests using Excel. Each problem uses a different dataset/worksheet. When formulas or functions need to be applied they must be used in order to receive credit for those questions. 1. Calculate confidence intervals and hypothesis test for two sample proportions (15 POINTS) Using the Enrollmenti determine what the sample proportions for 2005 and 2012 are for the variable Female Male which is an indicator for whether female enrollment is greater than male enrollment at a university. Build confidence intervals hypothesis testing for the difference in the proportion of schools with female enrollment greater than male enrollment between 2005 and 2012, i.e. (NOTE THE 2012 data stars on row 110) a. Use Excel to find confidence intervals for the location of the population difference between the proportion of schools with female enrollments greater than their malo enrollments, i.e. for alpha values of .05, and .01. b. Conduct a hypothesis test where and and without using Excel's built in T-Test formula. i. What is the critical value? ii. What is the test statistic? iii. What is the p-valuc? iv. What is the outcome of the hypothesis test? 2. Calculate confidence intervals and hypothesis test for two sample means with UKNOWN population variances (20 POINTS) Use the Enrollment2 worksheet and let the random variables denote the average female enrollment of universities sampled, and denote male enrollment of those universities sampled. Once you calculate the sample means, variances, and sample sizes next to their labels in excel you will find the degrees of freedom calculated in cell 18. a. Use Excel to find confidence intervals for the location of the population difference between female and male enrollment, i.e. for alpha values of .1, .05, and .01. Dashboard Calendar To Do Notifications Inbox 9:117 LTE O Back Excel Homework #4.docx ii. What is the test statistic? iii. What is the p-value? iv. What is the outcome of the hypothesis test? 2. Calculate confidence intervals and hypothesis test for two sample means with UKNOWN population variances (20 POINTS) Use the Enrollment2 worksheet and let the random variables denote the average female enrollment of universities sampled, and denote male enrollment of those universities sampled. Once you calculate the sample means, variances, and sample sizes next to their labels in excel you will find the degrees of freedom calculated in cell JS. a. Use Excel to find confidence intervals for the location of the population difference between female and male enrollment, i.e. for alpha values of 1, .05, and .01. b. Conduct a hypothesis test where and and without using Excel's built in T-Test formula i. What is the critical value? ii. What is the test statistic? iii. What is the p-value? iv. What is the outcome of the hypothesis test? c. Verify the p-value you found above using Excel's built-in T-Test formula. d. Compare the outcome of the hypothesis test and the confidence intervals in part (a). How are they related? 3. Perform a hypothesis test for matched pairs (15 POINTS) Use the Real Estate worksheet data to answer the following: a. Assume you want to test for whether between 2015 and 2016 the average change in home price across Indiana counties was something different than zero. i.e. and i. Calculate the test statistic ii. Calculate the p-value (NOT using the t.test Dashboard Calendar To Do Notifications Inbox 9:117 LTE O Back Excel Homework #4.docx MIZOS TICATI CUCIDCITI CACU you will not freedom calculated in cell 18. a. Use Excel to find confidence intervals for the location of the population difference between female and male enrollment, i.e. for alpha values of .1, .05, and .01. b. Conduct a hypothesis test where and and without using Excel's built in T-Test formula. i. What is the critical value? ii. What is the test statistic? iii. What is the p-value? iv. What is the outcome of the hypothesis test? c. Verify the p-value you found above using Excel's built-in T-Test formula d. Compare the outcome of the hypothesis test and the confidence intervals in part (a). How are they related? 3. Perform a hypothesis test for matched pairs (15 POINTS) Use the Real Estate worksheet data to answer the following: a. Assume you want to test for whether between 2015 and 2016 the average change in home price across Indiana counties was something different than zero. i.e. and i. Calculate the test statistic ii. Calculate the p-value (NOT using the t.test function) iii. Determine the critical values at the 1%, 5%, and 10% significance levels. iv. Which of the significance levels above can you reject the null at? b. Use the built in T. Test function to determine the p-value for the above hypothesis test. Dashboard Calendar To Do Notifications Inbox Foto w V 11 BLUE 5 A AB A A 6. ! ! h F H 1 1 G Problems K 1 Mean Variance Sarple Size 0 in) M A B 1 County State 2 Adams IN BartholomiN 4 Benton IN 5 Blackdord IN 5 Boone IN 7 Brown IN 3 Carroll IN 9 Cass IN 10 Clark IN 1 day IN 12 Clinton IN 13 Davies IN 14 DeKalb 15 Dearborn IN 36 Decatur IN 17 Delaware IN 18 Dubois IN 19 Ekhart IN 20 Floyd IN 21 Fountain IN 22 Franklin IN 23 Fulton IN 24 Gibran IN 25 Grant IN 26 Greene IN 27 Hamilton IN 25 Hancock IN 29 Harrison IN go Hendricks IN 31 Henry IN 32 Howard IN D Mean Home Sale Price2015 Mean HomeSale Price 2016 Difference 89854 164 878125 171117.08 1833875 71150 77737.5 67137.5 62133.207 249285.75 274508.97 218334 230365.67 1204375 1372375 67768.25 61916.668 145895.83 15758333 81595.836 92270.836 82965.836 77758.136 93342.859 103004.16 109041.66 12221654 155875.2 156729.17 123075 131295.8) 77975 80608336 158079.17 150962.5 13349167 145620.83 142190 166195.13 80861.586 75895.836 137933.33 136783.33 114351.11 101258.34 91375 98666.625 81566.000 137.5 101556,25 97041,664 293348.92 31188791 163344,17 178058.75 128370.84 140504.17 188123.75 19765833 82825 80141.667 83985.836 85000 336 OY Comente Torment b) + Real Estate o - 18 AR AO SA E G H 33 Hurtit 21 Slack Spe IN lay N 37 es IN 33 TO IN 39 inson IN 40 KRO IN 41 Porte IN d2 Engrange IN 3 Lake IN 4. Lawrence IN 5 Madison IN 15 Marion 97 Marshall IN 9 Martin IN 49 Miami IN 50 Monroe IN MontgOIN Marian IN 59 Newton IN 540 Noble IN 56 Craige IN 56 Owen IN Porter YN 58 Pasay IN 59 Pulski IN Putham IN 61 Randolph N 2 Hus IN 63 Shelby IN IN S4 Spencer OSO 87496.25 11870834 151691.657 79654 164 1190018 34 97929. 164 183038,63 182673.75 1447625 153341,67 139203 92 95677.086 76645836 120125 155902.3 88333.336 74475 164966.67 98583.335 147037.5 95169789 121227.09 89650 1239375 195670.75 121762.09 89800 121929.16 67912.5 8860-1,086 103941.59 1486625 788625 117175 158650 72863.539 125075 102408.34 189085.42 1774375 140562.5 162916.67 141855.83 949125 75616,664 119541.66 156879.12 98544.164 72404.164 184212.05 102000 157258.33 98595.836 1281.79.16 93095.836 12483.34 212272.83 126683.29 92470.836 125079.18 61505 79.789 1058 14234.67 Heal Estate Eeriment Et + Horn DS OTEM RW B FU A Aa AN A b) B D E F G H 1 55 Orange 56 Owen IN SX Porter IN su Pasily IN 54 Pulaski IN 60 Putram IN 61 Randolph IN 52 Rush IN 63 Shelby IN 64 Spencer IN 65 St. Joseph IN 66 Starke IN 67 Steuben IN 68 Sullivan IN 69 Switzerlan IN 70 Tippecano IN 71 Vanderburi 172 Vito 13 Wabash 74 Warrick 75 Washingt.IN 76 Wayne 72 Wells 78 White 79 80 81 82 33 84 89650 123937,5 195670.25 121762.09 89800 121929.16 679125 886041.086 103901 59 148662.5 92199.914 106263 168745.83 87211 159079.12 142270.81 108074 88666.664 89462.5 174286.55 107275 74783.336 106516.66 137860 93095.836 120333 34 212272.83 126683.29 92470.836 125079.16 51505 90670.789 106852.09 14334167 95337.5 104173.75 189275 79220.836 144216.67 156379.17 102394,75 88295.789 84975 180799.05 102731-25 77814.586 105.84 132845.83 2 2 2 2 2 2 2 15 28 Real Estate Enrolmen Intimenti Ve A H L M N O 4 1 2 3 Problem 2 Male Sample Mean Sample Variance Samole 5 6 7 DOR DIN 93 DIV/0! Alpha I values Lower Bound Upper lourd 3 10 11 12 13 01 0.05 0.01 bi 15 15 17 18 19 20 21 22 23 24 576./2/2/1/2011 A D Year Classificati Melende Femalen Total de Enrolment 10.000 2012 NCAA 7449 1015 1790 1 2012 NCAA DI 1372 28063 2012 NCAA D 15127 1571 30145 2012 NCAA DI 1619 17155 23902 1 2012 NCAA DIN 3723 0 2012 NCAA DIV 900 8162 17766 1 2012 NCAA DI 8170 10113 18283 1 2012 NCAA DIVI 7310 9830 17140 1 2012 NCAA DI 5215 6503 12716 1 2012 NCAA D 7265 10241 17500 1 2012 NCAA Divi 8821 4300 13150 1 2012 NCAA DIV 3653 3346 6999 0 2012 NCAA DI 23656 9706 23364 1 2012 NCAA Divi 3805 4714 2519 O 2012 NCAA DI 3969 8991 17950 1 2012 NCAA D 9606 7691 17297 1 2012 NCAA Divi 8739 962 18367 1 2012 NCAAD 9625 7948 17573 1 2012 NCAA DIVI 9793 11734 21537 1 2012 NCAA DV 8975 8476 17451 1 2012 NCAA 8909 17492 1 2012 NCAA DI 6091 7603 13694 1 2012 NCAA 39:36 8910 16855 1 2012 NCAA DIVE 13 14443 27892 1 2012 NCAA DI 9667 10522 20189 1 2012 NCAA DIV 5852 6543 12395 1 2012 NCAA Die 4792 4967 9759 2012 NCAA DE 6985 B404 15389 1 2012 NCAA DI 10398 13300 23698 1 2012 NCAA Divi 5987 7678 1 2012 NCAA Divi 9176 9273 18449 1 d) 8588 26 27 29 10 13665 32 33 Fiat + Comenta Enrolment o G Type here to search 11 B 1 UE P As A HOE $1 te A " DOM.11 V 1 H Problema Male Sample Me Sample Variante 1 1096 OLTA 0 00 DIV/ O 6 06 IL Alpha Lower Bond Upper Bowl 17506 Tu 01 005 0.01 14 15 lo D Year Classificationde Female Total de 10,000 2012 NCAA DI 104 1 2012 NCAA DI 1373 2805) 1 2012 NCAADW 15127 15718 3015 1 2012 NCAA DW 16749 17153 33902 2012 NCAA DW 1396 2127 3221 0 2012 NCAA D 8162 1776 2012 NCAA 1081) 123 1 2012 NCAA 7310 17140 1 2012 NCAA DI 215 650) 12718 1 2012 NCAA 7265 10241 1 3032 NCAA 001 30 13190 1 2012 NCAA 3653 346 699 0 2012 NCAA 9700 73164 2012 NCAA 4714 8519 0 2012 NCADA 8991 1760 2013 NCAA 2606 2001 1739) 1 2012 NCAA DIV 8739 18167 1 2012 NCAA DA 9625 790 1753 1 2012 NCAA 1171 21527 1 2012 NCAA DI 846 17451 1 2012 NCAA DI 857 109 17997 2012 NMD 8091 260) 13 1 2012 NCAA ON 899 1655 1 2012 NCM 13449 1413 27992 1 2013 NCAA 9667 10522 2018 1 2012 NCAA DI 5852 6541 12195 1 2012 NCAA DI 4792 4962 9259 0 2012 NCAA DIV SRS 1404 1539 1 2012 NCAA 13100 236 2012 NCAA DI 5987 1 2012 NCAA 9176 9273 18449 1 SORE 6958 41 1 w 23 24 25 26 27 28 29 30 31 32 22 9232 o G ED Type here to search Data View Draw Formulas Review File Home Insert A 25 Aa calibr (Body 11 BIU G A C I 1 0 1 > 2799 30 2005 NCAA DIVE 8197 31 2005 NCAA DIV 6873 32 2005 NCAA DIN 6136 31 2005 NCAA 7086 34 2005 NCAA DI 8668 35 2005 NCAA DI 8491 36 2005 NCAA DI 7207 37 2005 NCAA DIVI 8050 38 2005 NCAA DI 15881 39 2005 NCAA DII 11169 40 2005 NCAA DIV 5021 41 2005 NCAA OM 3039 42 2005 NCAA DIVE 5840 43 2005 NCAA DIV 7421 2005 NCAA ON 4076 2005 NCAA DIVI 7425 2005 NCAA DM 1485S 47 2005 NCAA DIV 43 2005 NCAA 12074 49 2005 NCAA DV 12816 50 2005 NCAA DIVE 51 2005 NCAA OM 5278 2005 NCAA DIVE 12000 57 2000 NCAA DIN 5438 50 2005 NCAA 12387 55 2005 NCAA DV 3817 2005 NCAA OW 13837 57 2005 NCAA DIV 4383 58 2006 NCAA 6273 2005 NCAA DIV 6845 2005 NCAA ON 2005 NCAAD 6633 2008 NCAA 9116 2005 NCAA 3872 200 AANW 3123 2000 NCAA DI 1592 Th 4 M B 5025 2005 NCAA DV 4614 200 MO 17723 2005 NCAA 10 2005 NCAA OW 362 11 20 NCMO 319 90 8231 7910 11112 8022 BOR9 10681 16584 11953 5730 3254 5258 8411 3542 2974 17345 3327 12372 15805 7732 7888 14.470 5310 33361 4228 13623 3177 3506 7267 50641 2321 7795 3827 1181 4900 3945 2014 1604 9322 sen 1629 7368 O 2 a 1 1 1 1 1 1 0 1 1 0 0 1 1 1 1 0 0 1 3 1 1 0 1 0 Real Estate Errota Enrollment + 1 Type here to search o G O c C fx H f G c 1 0 1 0 1 2 1 1 0 1 0 1 0 0 1 1 1 A B D 72 2005 NCAA DIVE 4614 5624 73 2005 NCAA DIVE 12386 8701 8202 74 7870 2005 NCAA Divi 1476 75 1551 2005 NCAA DIV 76 2005 NCAA DIV BABS 9709 77 2005 NCAA DIVI 9194 9545 78 2005 NCAA DIVE 4248 6479 79 2005 NCAA Divi 3625 4565 80 2005 NCAA DIVL 8566 5885 81 2005 NCAA DIVE 12634 14323 82 2005 NCAA DIVE 16764 16321 83 2005 NCAA DIVE 2026 2112 84 2005 NCAA DIV 3436 3079 85 2005 NCAA DIVE 5919 5824 86 2005 NCAA DIV 10274 12021 87 2005 NCAA DIVE 14615 17335 88 2005 NCAA DIVI 5294 6834 89 2005 NCAA DIVE 15978 17709 90 2005 NCAA DIVE 8996 12600 91 2005 NCAA DIVE 7685 8:09 92 2005 NCAA DIVE 7950 3659 93 2005 NCAA DIVE 1265 104 94 2005 NCAA DIVE 9767 12963 95 2005 NCAA DIVE 8217 9074 96 2005 NCAA DIVE 11405 9416 97 2005 NCAA DIV 9995 8464 58 2005 NCAA DIV 10998 8228 99 2005 NCAA DIVI 17811 11902 100 2005 NCAA DIVE 11493 13234 101 2005 NCAA DIM 8453 7645 102 2005 NCAA Divi 2369 100 2005 NCAA DIVE 2654 4064 2005 NCAA Divi 5288 5855 105 2005 NCAA DIVE 9383 10183 106 2005 NCAA DIVI 5323 6318 107 2005 NCAA DIV 10327 13525 2005 NCAA DIVE 10958 8475 100 2005 NCAA DIVI 7175 6078 110 2012 NCAA DIVI 7310 9830 2012 NCAA DIVI 6215 6503 732 2012 NCAA DIV 10241 11 2012 NCAA OM 821 4309 2012 NCAA OM 3653 3346 Real Estate Enrollment 1 0 1 1 0 0 0 0 1 O 1 1 1 1 1 1 0 0 1 1 1 0 a Enrollment1 IL + o G 20 Type here to search fc G E F > 0 1 O 1 0 1 0 1 1 1 1 1 1 + A B D suun ZOTT 115 2012 NCAA DIVE 13656 9708 3805 2012 NCAA Divi 4714 116 8991 117 8969 2012 NCAA DM 118 2012 NCAA DIVE 9606 7691 8739 2012 NCAA DIVI 9528 119 120 2012 NCAA DIVE 9625 7948 9793 2012 NCAA DIVE 11734 121 122 2012 NCAA OM 8975 8476 123 2012 NCAA DIVE 8588 8909 124 2012 NCAA DIVI 5091 7603 125 2012 NCAA DIVI 7936 8919 125 2012 NCAA DIVE 13449 14443 127 2012 NCAA DIVE 9667 10522 2012 NCAA DIVE 5852 6543 129 2012 NCAA DIV 4792 4967 130 2012 NCAA DIV 5985 8404 131 2012 NCAA DIVI 10398 13300 132 2012 NCAA Divt 5987 7678 133 2012 NCAA DIVE 9176 9273 134 2012 NCAA DE 3663 5927 135 2012 NCAA DIVE 1696 1293 136 2012 NCAA DIV 12838 11526 2012 NCAA DIVI 12307 15058 138 2012 NCAA Divi 11913 13103 139 2012 NCAA DWI 12028 13018 2012 NCAA DIV 3373 3339 2012 NCAA Divi 18736 17367 142 2012 NOAA OM 8572 8551 143 2012 NCAA DIVE 610 1134 2012 NCAA DV 5433 6151 145 2012 NCAA DIV 6399 7766 146 2012 NCAA DIVI 8759 8928 161 2012 NCAA DV 9419 10030 TALE 2012 NCAA DIVE 5637 6890 109 2012 NCAA DI 12866 10690 150 2012 NCAA OM 13254 14809 151 2012 NCAA DV 1847 3225 152 2012 NCAA UW 6682 153 2012 NCAA DIVI 7254 7233 154 2012 NCAA 9516 159 2012 NCAA W 7328 2003 150 2012 NCAA DIVI 16748 19930 2011 MAR Real Estate Enrollment Type here to search 0 0 1 1 1 0 0 0 1 1 1 1 1 1 0 1 1 1 0 0 1 1 Enrollment1 + f G RO 3 B 1 Calibri (Body 11 G H 0 1 0 D 1 0 0 0 0 1 D 1920 7732 2692 6258 13325 8362 9418 11524 9845 4336 17465 6555 1866 16053 3228 12687 2387 2174 9474 4036 13816 4964 13581 14553 3063 7132 7531 4727 12246 8415 9834 7804 1 1 > A B C NG 357 2012 NCAA DE 6193 155 2012 NCAA DIV 3561 159 2012 NCAA DIV 5760 160 2012 NCAA DHE 10208 161 2012 NCAA DIVI 9287 162 2012 NCAA DIVE 11700 2012 NCAA DIVE 11013 164 2012 NCAA DIVE 10160 165 2012 NCAA DIVE 4150 166 2012 NCAA DIVE 20154 167 2012 NCAAD 6852 168 2012 NCAA DV 1903 1 2012 NCAA DIN 12477 170 2012 NCAA DIVE 171 2012 NCAA DIM 10142 172 2012 NCAA DIVE 5202 173 2012 NCAA DIVI 7830 174 2012 NCAA DIV 12191 TTS 2012 NCAA DIV 4223 176 2012 NCAA OM 14522 177 2012 NCAA Divi 4419 178 2012 NCAA DIVI 10642 179 2012 NCAA DM 15375 190 2012 NCAA DIVI 29,99 151 2012 NCAA DIVE 2012 NCAA DI 5169 183 2012 NCAA DIV 3497 184 2012 NCAA DIVE 185 2012 NCAA DM 8902 196 2012 NCAA DIVI 2012 NCAAN 986 2012 NCAA DI 2012 NCAA DIV 4518 100 2012 NCAA DIV 6710 10 2012 NCAA OM 16956 392 2012 NAAM 550 193 2012 NCAA DV 16 2012 NCAA 2012 NCAA 2739 196 2012 NCAA DI 11721 191 2012 NCAAM 24950 195 2012 NCAA DI 2015 0 0 1 1 0 1 1 1 1 o 0 1 0 1 O 1 0 1 17002 856 3935 BA 18754 131 2008 10798 3614 1333 24520 18413 13667 0 O 1 1 o o Fal Estate + Enrolment Eruralimenti o EP c Type here to search s BLUE E! Aa Calibri (Body Aa 11 fx H 4 1 1 0 D 7804 4809 3935 8884 13764 8131 3003 10799 3684 13388 24920 18433 9707 10502 7609 13712 4375 12650 9746 9254 999 187 188 189 190 191 192 193 194 195 196 197 198 199 200 201 202 203 204 205 206 207 208 209 210 0 A 2012 NCAA DIM 2012 NCAA DIVI 2012 NCAA DIVI 2012 NCAA DIVE 2012 NCAA DIVE 2012 NCAA DIVE 2012 NCAA DIVE 2012 NOMAD 2012 NCAA DIVI 2012 NCAA DM 2012 NCAA DIV 2012 NCAA DIV 2012 NCAA DIV 2012 NCAA DIVE 2012 NCAA DIV 2012 NCAA DIVE 2012 NCAA DI 2012 NCAA DIVI 2012 NCAA DIVE 2012 NCAA DIVI 2012 NCAA DIVE 2012 NCAA Ovi 2012 NCAA DI 2012 NCAA DIV 2012 NCAA DIVE 2012 NCAA 2012 NCAA DIV 2012 NCAA DIVI 2012 NCAA DIVE 2012 NCAA DI 2012 NCAA DIV 2012 NCAA DM 2012 NCAA OVI 2012 NCAA DM 2012 NCAA DIV 2012 NCAADHI 2012 NCAA DIV 2012 NCAA DIVE 2012 NCAA DIV 8838 3587 4518 6710 16956 6560 9499 12607 2759 11721 24950 20275 9402 7585 6996 12481 3342 11220 10431 7534 10216 11618 10173 11804 5382 8298 7065 3.100 2253 17637 13254 7506 BAO 10364 13745 326 5568 1246 13493 212 212 214 215 216 217 218 219 220 221 11559 10098 12426 5339 7272 8759 8128 2458 19087 16730 10140 8180 14034 13209 4855 7524 3238 10525 OOOOHHHHHHO 1 0 223 2004 OO 220 227 Real Estate Enrollment Enrollment1 18 O 2 Type here to search 9:117 LTE O Back Excel Homework #4.docx G Excel Homework #4: Confidence Intervals and Hypothesis Testing for two populations This assignment deals with confidence intervals and hypothesis tests using Excel. Each problem uses a different dataset/worksheet. When formulas or functions need to be applied they must be used in order to receive credit for those questions. 1. Calculate confidence intervals and hypothesis test for two sample proportions (15 POINTS) Using the Enrollmenti determine what the sample proportions for 2005 and 2012 are for the variable Female Male which is an indicator for whether female enrollment is greater than male enrollment at a university. Build confidence intervals hypothesis testing for the difference in the proportion of schools with female enrollment greater than male enrollment between 2005 and 2012, i.e. (NOTE THE 2012 data stars on row 110) a. Use Excel to find confidence intervals for the location of the population difference between the proportion of schools with female enrollments greater than their malo enrollments, i.e. for alpha values of .05, and .01. b. Conduct a hypothesis test where and and without using Excel's built in T-Test formula. i. What is the critical value? ii. What is the test statistic? iii. What is the p-valuc? iv. What is the outcome of the hypothesis test? 2. Calculate confidence intervals and hypothesis test for two sample means with UKNOWN population variances (20 POINTS) Use the Enrollment2 worksheet and let the random variables denote the average female enrollment of universities sampled, and denote male enrollment of those universities sampled. Once you calculate the sample means, variances, and sample sizes next to their labels in excel you will find the degrees of freedom calculated in cell 18. a. Use Excel to find confidence intervals for the location of the population difference between female and male enrollment, i.e. for alpha values of .1, .05, and .01. Dashboard Calendar To Do Notifications Inbox 9:117 LTE O Back Excel Homework #4.docx ii. What is the test statistic? iii. What is the p-value? iv. What is the outcome of the hypothesis test? 2. Calculate confidence intervals and hypothesis test for two sample means with UKNOWN population variances (20 POINTS) Use the Enrollment2 worksheet and let the random variables denote the average female enrollment of universities sampled, and denote male enrollment of those universities sampled. Once you calculate the sample means, variances, and sample sizes next to their labels in excel you will find the degrees of freedom calculated in cell JS. a. Use Excel to find confidence intervals for the location of the population difference between female and male enrollment, i.e. for alpha values of 1, .05, and .01. b. Conduct a hypothesis test where and and without using Excel's built in T-Test formula i. What is the critical value? ii. What is the test statistic? iii. What is the p-value? iv. What is the outcome of the hypothesis test? c. Verify the p-value you found above using Excel's built-in T-Test formula. d. Compare the outcome of the hypothesis test and the confidence intervals in part (a). How are they related? 3. Perform a hypothesis test for matched pairs (15 POINTS) Use the Real Estate worksheet data to answer the following: a. Assume you want to test for whether between 2015 and 2016 the average change in home price across Indiana counties was something different than zero. i.e. and i. Calculate the test statistic ii. Calculate the p-value (NOT using the t.test Dashboard Calendar To Do Notifications Inbox 9:117 LTE O Back Excel Homework #4.docx MIZOS TICATI CUCIDCITI CACU you will not freedom calculated in cell 18. a. Use Excel to find confidence intervals for the location of the population difference between female and male enrollment, i.e. for alpha values of .1, .05, and .01. b. Conduct a hypothesis test where and and without using Excel's built in T-Test formula. i. What is the critical value? ii. What is the test statistic? iii. What is the p-value? iv. What is the outcome of the hypothesis test? c. Verify the p-value you found above using Excel's built-in T-Test formula d. Compare the outcome of the hypothesis test and the confidence intervals in part (a). How are they related? 3. Perform a hypothesis test for matched pairs (15 POINTS) Use the Real Estate worksheet data to answer the following: a. Assume you want to test for whether between 2015 and 2016 the average change in home price across Indiana counties was something different than zero. i.e. and i. Calculate the test statistic ii. Calculate the p-value (NOT using the t.test function) iii. Determine the critical values at the 1%, 5%, and 10% significance levels. iv. Which of the significance levels above can you reject the null at? b. Use the built in T. Test function to determine the p-value for the above hypothesis test. Dashboard Calendar To Do Notifications Inbox Foto w V 11 BLUE 5 A AB A A 6. ! ! h F H 1 1 G Problems K 1 Mean Variance Sarple Size 0 in) M A B 1 County State 2 Adams IN BartholomiN 4 Benton IN 5 Blackdord IN 5 Boone IN 7 Brown IN 3 Carroll IN 9 Cass IN 10 Clark IN 1 day IN 12 Clinton IN 13 Davies IN 14 DeKalb 15 Dearborn IN 36 Decatur IN 17 Delaware IN 18 Dubois IN 19 Ekhart IN 20 Floyd IN 21 Fountain IN 22 Franklin IN 23 Fulton IN 24 Gibran IN 25 Grant IN 26 Greene IN 27 Hamilton IN 25 Hancock IN 29 Harrison IN go Hendricks IN 31 Henry IN 32 Howard IN D Mean Home Sale Price2015 Mean HomeSale Price 2016 Difference 89854 164 878125 171117.08 1833875 71150 77737.5 67137.5 62133.207 249285.75 274508.97 218334 230365.67 1204375 1372375 67768.25 61916.668 145895.83 15758333 81595.836 92270.836 82965.836 77758.136 93342.859 103004.16 109041.66 12221654 155875.2 156729.17 123075 131295.8) 77975 80608336 158079.17 150962.5 13349167 145620.83 142190 166195.13 80861.586 75895.836 137933.33 136783.33 114351.11 101258.34 91375 98666.625 81566.000 137.5 101556,25 97041,664 293348.92 31188791 163344,17 178058.75 128370.84 140504.17 188123.75 19765833 82825 80141.667 83985.836 85000 336 OY Comente Torment b) + Real Estate o - 18 AR AO SA E G H 33 Hurtit 21 Slack Spe IN lay N 37 es IN 33 TO IN 39 inson IN 40 KRO IN 41 Porte IN d2 Engrange IN 3 Lake IN 4. Lawrence IN 5 Madison IN 15 Marion 97 Marshall IN 9 Martin IN 49 Miami IN 50 Monroe IN MontgOIN Marian IN 59 Newton IN 540 Noble IN 56 Craige IN 56 Owen IN Porter YN 58 Pasay IN 59 Pulski IN Putham IN 61 Randolph N 2 Hus IN 63 Shelby IN IN S4 Spencer OSO 87496.25 11870834 151691.657 79654 164 1190018 34 97929. 164 183038,63 182673.75 1447625 153341,67 139203 92 95677.086 76645836 120125 155902.3 88333.336 74475 164966.67 98583.335 147037.5 95169789 121227.09 89650 1239375 195670.75 121762.09 89800 121929.16 67912.5 8860-1,086 103941.59 1486625 788625 117175 158650 72863.539 125075 102408.34 189085.42 1774375 140562.5 162916.67 141855.83 949125 75616,664 119541.66 156879.12 98544.164 72404.164 184212.05 102000 157258.33 98595.836 1281.79.16 93095.836 12483.34 212272.83 126683.29 92470.836 125079.18 61505 79.789 1058 14234.67 Heal Estate Eeriment Et + Horn DS OTEM RW B FU A Aa AN A b) B D E F G H 1 55 Orange 56 Owen IN SX Porter IN su Pasily IN 54 Pulaski IN 60 Putram IN 61 Randolph IN 52 Rush IN 63 Shelby IN 64 Spencer IN 65 St. Joseph IN 66 Starke IN 67 Steuben IN 68 Sullivan IN 69 Switzerlan IN 70 Tippecano IN 71 Vanderburi 172 Vito 13 Wabash 74 Warrick 75 Washingt.IN 76 Wayne 72 Wells 78 White 79 80 81 82 33 84 89650 123937,5 195670.25 121762.09 89800 121929.16 679125 886041.086 103901 59 148662.5 92199.914 106263 168745.83 87211 159079.12 142270.81 108074 88666.664 89462.5 174286.55 107275 74783.336 106516.66 137860 93095.836 120333 34 212272.83 126683.29 92470.836 125079.16 51505 90670.789 106852.09 14334167 95337.5 104173.75 189275 79220.836 144216.67 156379.17 102394,75 88295.789 84975 180799.05 102731-25 77814.586 105.84 132845.83 2 2 2 2 2 2 2 15 28 Real Estate Enrolmen Intimenti Ve A H L M N O 4 1 2 3 Problem 2 Male Sample Mean Sample Variance Samole 5 6 7 DOR DIN 93 DIV/0! Alpha I values Lower Bound Upper lourd 3 10 11 12 13 01 0.05 0.01 bi 15 15 17 18 19 20 21 22 23 24 576./2/2/1/2011 A D Year Classificati Melende Femalen Total de Enrolment 10.000 2012 NCAA 7449 1015 1790 1 2012 NCAA DI 1372 28063 2012 NCAA D 15127 1571 30145 2012 NCAA DI 1619 17155 23902 1 2012 NCAA DIN 3723 0 2012 NCAA DIV 900 8162 17766 1 2012 NCAA DI 8170 10113 18283 1 2012 NCAA DIVI 7310 9830 17140 1 2012 NCAA DI 5215 6503 12716 1 2012 NCAA D 7265 10241 17500 1 2012 NCAA Divi 8821 4300 13150 1 2012 NCAA DIV 3653 3346 6999 0 2012 NCAA DI 23656 9706 23364 1 2012 NCAA Divi 3805 4714 2519 O 2012 NCAA DI 3969 8991 17950 1 2012 NCAA D 9606 7691 17297 1 2012 NCAA Divi 8739 962 18367 1 2012 NCAAD 9625 7948 17573 1 2012 NCAA DIVI 9793 11734 21537 1 2012 NCAA DV 8975 8476 17451 1 2012 NCAA 8909 17492 1 2012 NCAA DI 6091 7603 13694 1 2012 NCAA 39:36 8910 16855 1 2012 NCAA DIVE 13 14443 27892 1 2012 NCAA DI 9667 10522 20189 1 2012 NCAA DIV 5852 6543 12395 1 2012 NCAA Die 4792 4967 9759 2012 NCAA DE 6985 B404 15389 1 2012 NCAA DI 10398 13300 23698 1 2012 NCAA Divi 5987 7678 1 2012 NCAA Divi 9176 9273 18449 1 d) 8588 26 27 29 10 13665 32 33 Fiat + Comenta Enrolment o G Type here to search 11 B 1 UE P As A HOE $1 te A " DOM.11 V 1 H Problema Male Sample Me Sample Variante 1 1096 OLTA 0 00 DIV/ O 6 06 IL Alpha Lower Bond Upper Bowl 17506 Tu 01 005 0.01 14 15 lo D Year Classificationde Female Total de 10,000 2012 NCAA DI 104 1 2012 NCAA DI 1373 2805) 1 2012 NCAADW 15127 15718 3015 1 2012 NCAA DW 16749 17153 33902 2012 NCAA DW 1396 2127 3221 0 2012 NCAA D 8162 1776 2012 NCAA 1081) 123 1 2012 NCAA 7310 17140 1 2012 NCAA DI 215 650) 12718 1 2012 NCAA 7265 10241 1 3032 NCAA 001 30 13190 1 2012 NCAA 3653 346 699 0 2012 NCAA 9700 73164 2012 NCAA 4714 8519 0 2012 NCADA 8991 1760 2013 NCAA 2606 2001 1739) 1 2012 NCAA DIV 8739 18167 1 2012 NCAA DA 9625 790 1753 1 2012 NCAA 1171 21527 1 2012 NCAA DI 846 17451 1 2012 NCAA DI 857 109 17997 2012 NMD 8091 260) 13 1 2012 NCAA ON 899 1655 1 2012 NCM 13449 1413 27992 1 2013 NCAA 9667 10522 2018 1 2012 NCAA DI 5852 6541 12195 1 2012 NCAA DI 4792 4962 9259 0 2012 NCAA DIV SRS 1404 1539 1 2012 NCAA 13100 236 2012 NCAA DI 5987 1 2012 NCAA 9176 9273 18449 1 SORE 6958 41 1 w 23 24 25 26 27 28 29 30 31 32 22 9232 o G ED Type here to search Data View Draw Formulas Review File Home Insert A 25 Aa calibr (Body 11 BIU G A C I 1 0 1 > 2799 30 2005 NCAA DIVE 8197 31 2005 NCAA DIV 6873 32 2005 NCAA DIN 6136 31 2005 NCAA 7086 34 2005 NCAA DI 8668 35 2005 NCAA DI 8491 36 2005 NCAA DI 7207 37 2005 NCAA DIVI 8050 38 2005 NCAA DI 15881 39 2005 NCAA DII 11169 40 2005 NCAA DIV 5021 41 2005 NCAA OM 3039 42 2005 NCAA DIVE 5840 43 2005 NCAA DIV 7421 2005 NCAA ON 4076 2005 NCAA DIVI 7425 2005 NCAA DM 1485S 47 2005 NCAA DIV 43 2005 NCAA 12074 49 2005 NCAA DV 12816 50 2005 NCAA DIVE 51 2005 NCAA OM 5278 2005 NCAA DIVE 12000 57 2000 NCAA DIN 5438 50 2005 NCAA 12387 55 2005 NCAA DV 3817 2005 NCAA OW 13837 57 2005 NCAA DIV 4383 58 2006 NCAA 6273 2005 NCAA DIV 6845 2005 NCAA ON 2005 NCAAD 6633 2008 NCAA 9116 2005 NCAA 3872 200 AANW 3123 2000 NCAA DI 1592 Th 4 M B 5025 2005 NCAA DV 4614 200 MO 17723 2005 NCAA 10 2005 NCAA OW 362 11 20 NCMO 319 90 8231 7910 11112 8022 BOR9 10681 16584 11953 5730 3254 5258 8411 3542 2974 17345 3327 12372 15805 7732 7888 14.470 5310 33361 4228 13623 3177 3506 7267 50641 2321 7795 3827 1181 4900 3945 2014 1604 9322 sen 1629 7368 O 2 a 1 1 1 1 1 1 0 1 1 0 0 1 1 1 1 0 0 1 3 1 1 0 1 0 Real Estate Errota Enrollment + 1 Type here to search o G O c C fx H f G c 1 0 1 0 1 2 1 1 0 1 0 1 0 0 1 1 1 A B D 72 2005 NCAA DIVE 4614 5624 73 2005 NCAA DIVE 12386 8701 8202 74 7870 2005 NCAA Divi 1476 75 1551 2005 NCAA DIV 76 2005 NCAA DIV BABS 9709 77 2005 NCAA DIVI 9194 9545 78 2005 NCAA DIVE 4248 6479 79 2005 NCAA Divi 3625 4565 80 2005 NCAA DIVL 8566 5885 81 2005 NCAA DIVE 12634 14323 82 2005 NCAA DIVE 16764 16321 83 2005 NCAA DIVE 2026 2112 84 2005 NCAA DIV 3436 3079 85 2005 NCAA DIVE 5919 5824 86 2005 NCAA DIV 10274 12021 87 2005 NCAA DIVE 14615 17335 88 2005 NCAA DIVI 5294 6834 89 2005 NCAA DIVE 15978 17709 90 2005 NCAA DIVE 8996 12600 91 2005 NCAA DIVE 7685 8:09 92 2005 NCAA DIVE 7950 3659 93 2005 NCAA DIVE 1265 104 94 2005 NCAA DIVE 9767 12963 95 2005 NCAA DIVE 8217 9074 96 2005 NCAA DIVE 11405 9416 97 2005 NCAA DIV 9995 8464 58 2005 NCAA DIV 10998 8228 99 2005 NCAA DIVI 17811 11902 100 2005 NCAA DIVE 11493 13234 101 2005 NCAA DIM 8453 7645 102 2005 NCAA Divi 2369 100 2005 NCAA DIVE 2654 4064 2005 NCAA Divi 5288 5855 105 2005 NCAA DIVE 9383 10183 106 2005 NCAA DIVI 5323 6318 107 2005 NCAA DIV 10327 13525 2005 NCAA DIVE 10958 8475 100 2005 NCAA DIVI 7175 6078 110 2012 NCAA DIVI 7310 9830 2012 NCAA DIVI 6215 6503 732 2012 NCAA DIV 10241 11 2012 NCAA OM 821 4309 2012 NCAA OM 3653 3346 Real Estate Enrollment 1 0 1 1 0 0 0 0 1 O 1 1 1 1 1 1 0 0 1 1 1 0 a Enrollment1 IL + o G 20 Type here to search fc G E F > 0 1 O 1 0 1 0 1 1 1 1 1 1 + A B D suun ZOTT 115 2012 NCAA DIVE 13656 9708 3805 2012 NCAA Divi 4714 116 8991 117 8969 2012 NCAA DM 118 2012 NCAA DIVE 9606 7691 8739 2012 NCAA DIVI 9528 119 120 2012 NCAA DIVE 9625 7948 9793 2012 NCAA DIVE 11734 121 122 2012 NCAA OM 8975 8476 123 2012 NCAA DIVE 8588 8909 124 2012 NCAA DIVI 5091 7603 125 2012 NCAA DIVI 7936 8919 125 2012 NCAA DIVE 13449 14443 127 2012 NCAA DIVE 9667 10522 2012 NCAA DIVE 5852 6543 129 2012 NCAA DIV 4792 4967 130 2012 NCAA DIV 5985 8404 131 2012 NCAA DIVI 10398 13300 132 2012 NCAA Divt 5987 7678 133 2012 NCAA DIVE 9176 9273 134 2012 NCAA DE 3663 5927 135 2012 NCAA DIVE 1696 1293 136 2012 NCAA DIV 12838 11526 2012 NCAA DIVI 12307 15058 138 2012 NCAA Divi 11913 13103 139 2012 NCAA DWI 12028 13018 2012 NCAA DIV 3373 3339 2012 NCAA Divi 18736 17367 142 2012 NOAA OM 8572 8551 143 2012 NCAA DIVE 610 1134 2012 NCAA DV 5433 6151 145 2012 NCAA DIV 6399 7766 146 2012 NCAA DIVI 8759 8928 161 2012 NCAA DV 9419 10030 TALE 2012 NCAA DIVE 5637 6890 109 2012 NCAA DI 12866 10690 150 2012 NCAA OM 13254 14809 151 2012 NCAA DV 1847 3225 152 2012 NCAA UW 6682 153 2012 NCAA DIVI 7254 7233 154 2012 NCAA 9516 159 2012 NCAA W 7328 2003 150 2012 NCAA DIVI 16748 19930 2011 MAR Real Estate Enrollment Type here to search 0 0 1 1 1 0 0 0 1 1 1 1 1 1 0 1 1 1 0 0 1 1 Enrollment1 + f G RO 3 B 1 Calibri (Body 11 G H 0 1 0 D 1 0 0 0 0 1 D 1920 7732 2692 6258 13325 8362 9418 11524 9845 4336 17465 6555 1866 16053 3228 12687 2387 2174 9474 4036 13816 4964 13581 14553 3063 7132 7531 4727 12246 8415 9834 7804 1 1 > A B C NG 357 2012 NCAA DE 6193 155 2012 NCAA DIV 3561 159 2012 NCAA DIV 5760 160 2012 NCAA DHE 10208 161 2012 NCAA DIVI 9287 162 2012 NCAA DIVE 11700 2012 NCAA DIVE 11013 164 2012 NCAA DIVE 10160 165 2012 NCAA DIVE 4150 166 2012 NCAA DIVE 20154 167 2012 NCAAD 6852 168 2012 NCAA DV 1903 1 2012 NCAA DIN 12477 170 2012 NCAA DIVE 171 2012 NCAA DIM 10142 172 2012 NCAA DIVE 5202 173 2012 NCAA DIVI 7830 174 2012 NCAA DIV 12191 TTS 2012 NCAA DIV 4223 176 2012 NCAA OM 14522 177 2012 NCAA Divi 4419 178 2012 NCAA DIVI 10642 179 2012 NCAA DM 15375 190 2012 NCAA DIVI 29,99 151 2012 NCAA DIVE 2012 NCAA DI 5169 183 2012 NCAA DIV 3497 184 2012 NCAA DIVE 185 2012 NCAA DM 8902 196 2012 NCAA DIVI 2012 NCAAN 986 2012 NCAA DI 2012 NCAA DIV 4518 100 2012 NCAA DIV 6710 10 2012 NCAA OM 16956 392 2012 NAAM 550 193 2012 NCAA DV 16 2012 NCAA 2012 NCAA 2739 196 2012 NCAA DI 11721 191 2012 NCAAM 24950 195 2012 NCAA DI 2015 0 0 1 1 0 1 1 1 1 o 0 1 0 1 O 1 0 1 17002 856 3935 BA 18754 131 2008 10798 3614 1333 24520 18413 13667 0 O 1 1 o o Fal Estate + Enrolment Eruralimenti o EP c Type here to search s BLUE E! Aa Calibri (Body Aa 11 fx H 4 1 1 0 D 7804 4809 3935 8884 13764 8131 3003 10799 3684 13388 24920 18433 9707 10502 7609 13712 4375 12650 9746 9254 999 187 188 189 190 191 192 193 194 195 196 197 198 199 200 201 202 203 204 205 206 207 208 209 210 0 A 2012 NCAA DIM 2012 NCAA DIVI 2012 NCAA DIVI 2012 NCAA DIVE 2012 NCAA DIVE 2012 NCAA DIVE 2012 NCAA DIVE 2012 NOMAD 2012 NCAA DIVI 2012 NCAA DM 2012 NCAA DIV 2012 NCAA DIV 2012 NCAA DIV 2012 NCAA DIVE 2012 NCAA DIV 2012 NCAA DIVE 2012 NCAA DI 2012 NCAA DIVI 2012 NCAA DIVE 2012 NCAA DIVI 2012 NCAA DIVE 2012 NCAA Ovi 2012 NCAA DI 2012 NCAA DIV 2012 NCAA DIVE 2012 NCAA 2012 NCAA DIV 2012 NCAA DIVI 2012 NCAA DIVE 2012 NCAA DI 2012 NCAA DIV 2012 NCAA DM 2012 NCAA OVI 2012 NCAA DM 2012 NCAA DIV 2012 NCAADHI 2012 NCAA DIV 2012 NCAA DIVE 2012 NCAA DIV 8838 3587 4518 6710 16956 6560 9499 12607 2759 11721 24950 20275 9402 7585 6996 12481 3342 11220 10431 7534 10216 11618 10173 11804 5382 8298 7065 3.100 2253 17637 13254 7506 BAO 10364 13745 326 5568 1246 13493 212 212 214 215 216 217 218 219 220 221 11559 10098 12426 5339 7272 8759 8128 2458 19087 16730 10140 8180 14034 13209 4855 7524 3238 10525 OOOOHHHHHHO 1 0 223 2004 OO 220 227 Real Estate Enrollment Enrollment1 18 O 2 Type here to search Step by Step Solution
There are 3 Steps involved in it
1 Expert Approved Answer
Step: 1 Unlock

Question Has Been Solved by an Expert!
Get step-by-step solutions from verified subject matter experts
Step: 2 Unlock
Step: 3 Unlock