

Question: solve 2 a and b. (a) For the data given below, calculate and plot pressure traverse in the tubing string using the HagedornBrown correlation: (b)
solve 2 a and b. 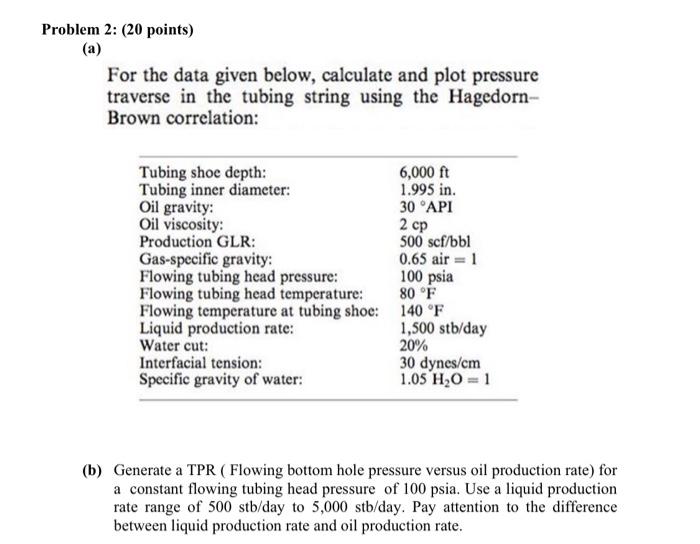
(a) For the data given below, calculate and plot pressure traverse in the tubing string using the HagedornBrown correlation: (b) Generate a TPR ( Flowing bottom hole pressure versus oil production rate) for a constant flowing tubing head pressure of 100psi. Use a liquid production rate range of 500stb/ day to 5,000stb/ day. Pay attention to the difference between liquid production rate and oil production rate
Step by Step Solution
There are 3 Steps involved in it
1 Expert Approved Answer
Step: 1 Unlock

Question Has Been Solved by an Expert!
Get step-by-step solutions from verified subject matter experts
Step: 2 Unlock
Step: 3 Unlock