

Question: solve #2 with code Question 1. We would like to relate players' game statistics to their salaries. Compute a table called full_data that includes one
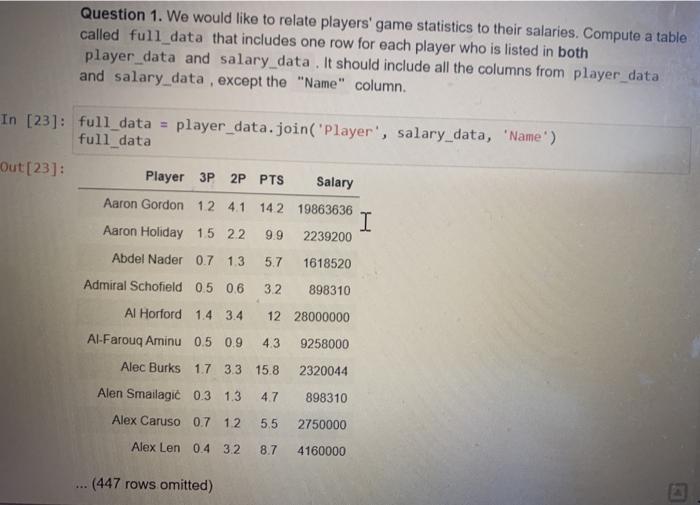
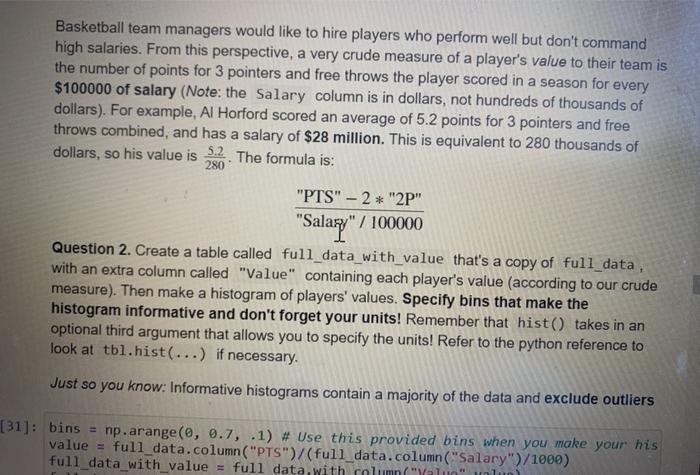
Question 1. We would like to relate players' game statistics to their salaries. Compute a table called full_data that includes one row for each player who is listed in both player_data and salary_data. It should include all the columns from player data and salary data , except the "Name" column. In [23]: full_data = player_data.join("Player', salary_data, 'Name') full_data Out [23]: Player 3P 2P PTS Salary Aaron Gordon 12 4.1 142 19863636 I Aaron Holiday 15 22 9.9 2239200 Abdel Nader 0.7 13 5.7 1618520 Admiral Schofield 0.5 0.6 32 898310 Al Horford 1.4 3.4 1228000000 Al-Farouq Aminu 0.5 0.9 4.3 9258000 Alec Burks 17 33 15.8 2320044 Alen Smailagi 0.3 1.3 4.7 898310 Alex Caruso 0.7 12 5.5 2750000 Alex Len 04 32 8.7 4160000 (447 rows omitted) Basketball team managers would like to hire players who perform well but don't command high salaries. From this perspective, a very crude measure of a player's value to their team is the number of points for 3 pointers and free throws the player scored in a season for every $100000 of salary (Note: the Salary column is in dollars, not hundreds of thousands of dollars). For example, Al Horford scored an average of 5.2 points for 3 pointers and free throws combined, and has a salary of $28 million. This is equivalent to 280 thousands of dollars, so his value is 5.2. The formula is: 280 "PTS" - 2* "2P" "Salary" / 100000 Question 2. Create a table called full_data_with_value that's a copy of full_data, with an extra column called "Value" containing each player's value (according to our crude measure). Then make a histogram of players' values. Specify bins that make the histogram informative and don't forget your units! Remember that hist() takes in an optional third argument that allows you to specify the units! Refer to the python reference to look at tbl.hist(...) if necessary. Just so you know: Informative histograms contain a majority of the data and exclude outliers [31]: bins = np.arange(0, 0.7, .1) # Use this provided bins when you make your his value = full_data.column("PTS")/(full_data.column("Salary")/1000) full_data_with value = full data with column("Yalno" all
Step by Step Solution
There are 3 Steps involved in it

Get step-by-step solutions from verified subject matter experts