Question: Solve a problem using sets and/or Venn diagrams Solve a problem aligned to Common Core Standards. Identify whether the number of objects in one group
Solve a problem using sets and/or Venn diagrams
Solve a problem aligned to Common Core Standards.
Identify whether the number of objects in one group is greater than, less than, or equal to the number of objects in another group, e.g., by using matching and counting strategies.
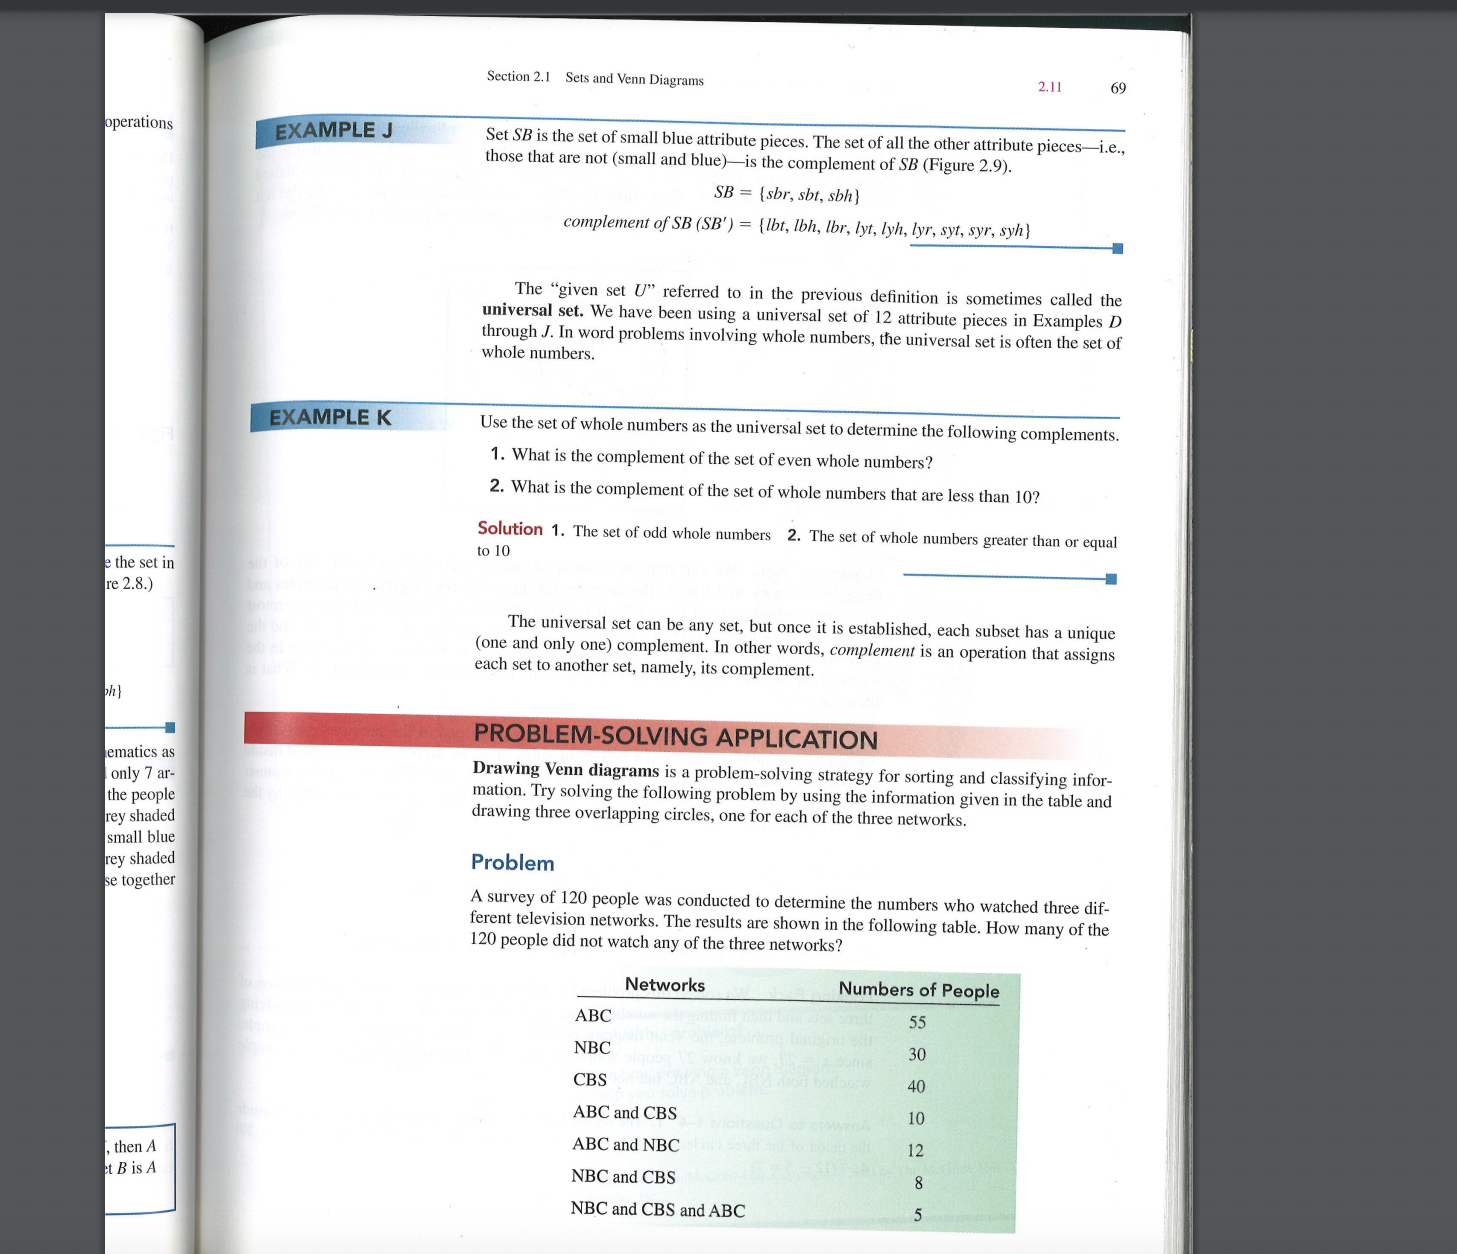
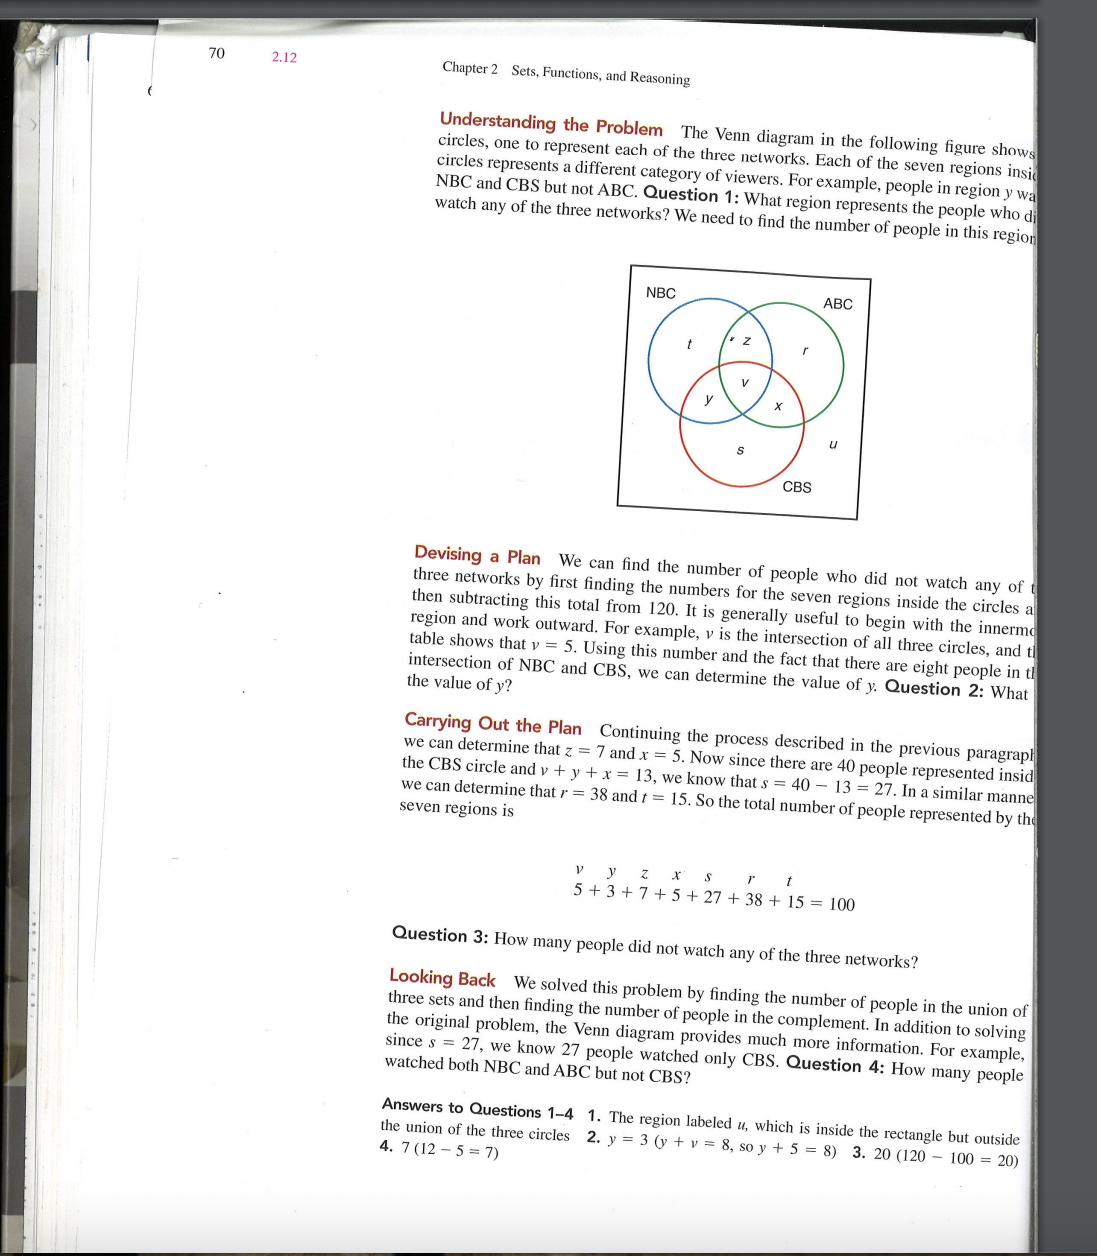
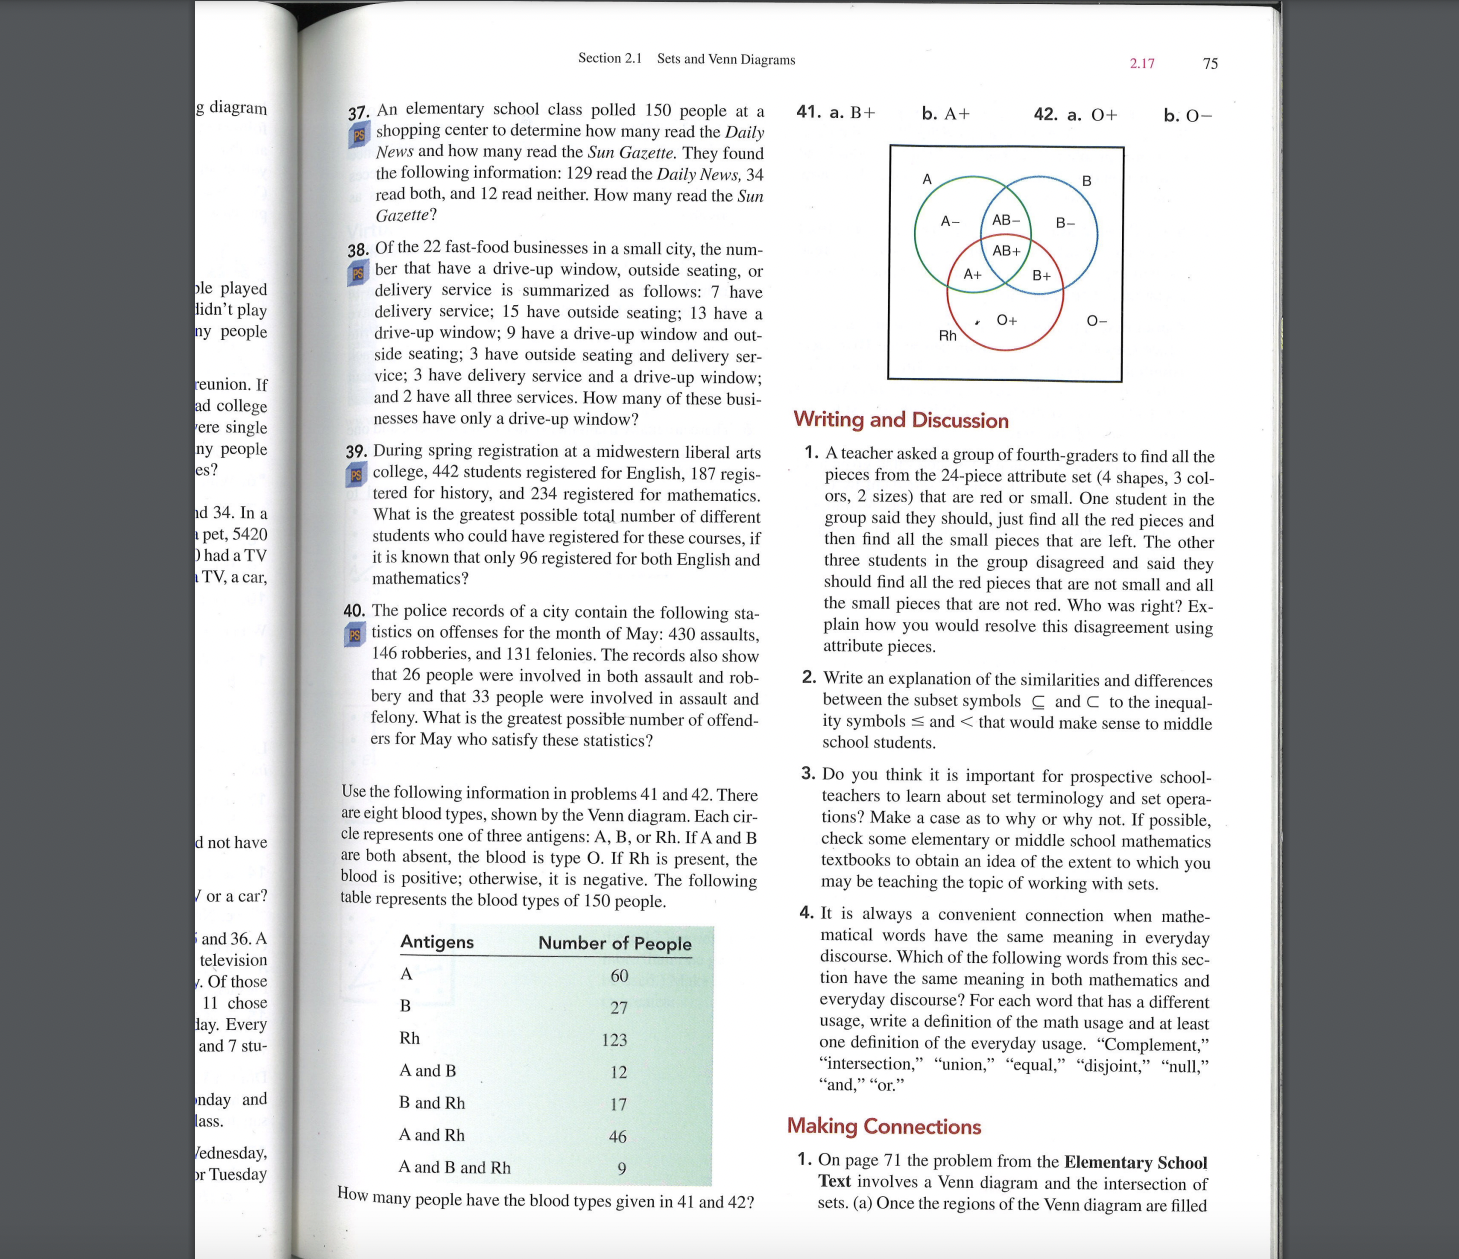
Section 2.1 Sets and Venn Diagrams 2.11 69 operations EXAMPLE J Set SB is the set of small blue attribute pieces. The set of all the other attribute pieces-i.e., those that are not (small and blue)-is the complement of SB (Figure 2.9) SB = {sbr, sht, shh } complement of SB (SB') = { Ibt, Ibh, Ibr, lyt, lyh, lyr, syt, syr, syh} The "given set U" referred to in the previous definition is sometimes called the universal set. We have been using a universal set of 12 attribute pieces in Examples D through J. In word problems involving whole numbers, the universal set is often the set of whole numbers. EXAMPLE K Use the set of whole numbers as the universal set to determine the following complements. 1. What is the complement of the set of even whole numbers? 2. What is the complement of the set of whole numbers that are less than 10? Solution 1. The set of odd whole numbers 2. The set of whole numbers greater than or equal to 10 the set in e 2.8.) The universal set can be any set, but once it is established, each subset has a unique (one and only one) complement. In other words, complement is an operation that assigns each set to another set, namely, its complement. phl PROBLEM-SOLVING APPLICATION ematics as only 7 ar- Drawing Venn diagrams is a problem-solving strategy for sorting and classifying infor- the people mation. Try solving the following problem by using the information given in the table and ey shaded drawing three overlapping circles, one for each of the three networks. small blue ey shaded Problem e together A survey of 120 people was conducted to determine the numbers who watched three dif- ferent television networks. The results are shown in the following table. How many of the 120 people did not watch any of the three networks? Networks Numbers of People ABC 55 NBC 30 CBS 40 ABC and CBS 10 then A ABC and NBC 12 t B is A NBC and CBS NBC and CBS and ABC70 2.12 Chapter 2 Sets, Functions, and Reasoning Understanding the Problem The Venn diagram in the following figure shows circles, one to represent each of the three networks. Each of the seven regions insic circles represents a different category of viewers. For example, people in region y wa NBC and CBS but not ABC. Question 1: What region represents the people who di watch any of the three networks? We need to find the number of people in this region NBC ABC CBS Devising a Plan We can find the number of people who did not watch any of t three networks by first finding the numbers for the seven regions inside the circles a then subtracting this total from 120. It is generally useful to begin with the innermo region and work outward. For example, v is the intersection of all three circles, and ti table shows that v = 5. Using this number and the fact that there are eight people in ti intersection of NBC and CBS, we can determine the value of y. Question 2: What the value of y? Carrying Out the Plan Continuing the process described in the previous paragraph we can determine that z = 7 and x = 5. Now since there are 40 people represented insid the CBS circle and v + y + x = 13, we know that s = 40 - 13 = 27. In a similar manne we can determine that r = 38 and f = 15. So the total number of people represented by the seven regions is vy Z 5 +3+7+5+27+38+15=100 Question 3: How many people did not watch any of the three networks? Looking Back We solved this problem by finding the number of people in the union of three sets and then finding the number of people in the complement. In addition to solving the original problem, the Venn diagram provides much more information. For example, since s = 27, we know 27 people watched only CBS. Question 4: How many people watched both NBC and ABC but not CBS? Answers to Questions 1-4 1. The region labeled u, which is inside the rectangle but outside the union of the three circles 2. y = 3 (y + v = 8, so y + 5 = 8) 3. 20 (120 - 100 = 20) 4. 7 (12 - 5 = 7)g diagram 16 played idn't play I y people eunion. If -. d college are single my people cs? :1 34. In a tpet, S420 lhad a TV TV, a car, I not have or a car? and 36. A television .. Of those l1 chose ay. Every and i' stu nday and ass. ednesday. ir Tuesd ay Section 2.1 Sets and Venn Diagram 2.]? T5 31' All elementary school class polled 150 people at a E shopping center to determine how many read the Daily New! and how many read the Sim Gazette, They found the following information: 129 read the Daily News, 34 read both, and 12 read neither. How many read the Sim Gazelle? 33, Of the 22 fastefood businesses in a small city, the num her that have a drive-up window, outside seating, or I delivery service is summarized as follows: 7' have delivery service; 15 have outside seating; 13 have a driveeup window; 9 have a driveeup window and out side seating; 3 have outside seating and delivery ser- vice; 3 have delivery service and a driveup window; and 2 have all three services. How many of these busi- ncsses have only a drivasup window? 39. During spring registration at a midwestern liberal arts I college, 442 students registered for English, 187 regis- tered for history, and 234 registered for mathematics. What is the greatest possible total number of different students who could have registered for these courses, if it is known that only 96 registered for both English and mathematics? 40. The police records of a city contain the following sta- ' tistics on offenses for the month of May: 430 assaults, 146 robberies. and 131 felonies, The records also show that 26 people were involved in both assault and rob bery and that 33 people were involved in assault and felony. What is the greatest possible number of ot'l'end- era for May who satisfy these statistics? Use the following information in problems 41 and 42. There are eight blood types, shown by the Venn diagram. Each cire cie represents one of three antigens: A, B, or Rh. HA and B are both absent, the blood is type 0. If Rh is present, the blood is positive; otherwise, it is negative. The following table represents the blood types of 150 people Antigens Number of People A 60 B 27 Rh l23 A and B 12 B and Rh 1'." A and Rh 46 A and B and Rh 9 HOW many people have the blood types given in 41 and 42? 41. a. B+ 1). A+ Writing and Discussion 1. A teacher asked a group of fourthegradcrs to nd all the pieces from the 24-picce attribute set (4 shapes, 3 col- ors, 2 sizes) that are red or small. One student in the group said they should. just nd all the red pieces and then nd all the small pieces that are left. The other three students in the group disagreed and said they should nd all the red pieces that are not small and all the small pieces that are not red. Who was right? Ex- plain how you would resolve this disagreement using attribute pieces. 2. Write an explanation of the similarities and differences between the subset symbols g and C to the inequale ity symbols 5 and
Step by Step Solution
There are 3 Steps involved in it
1 Expert Approved Answer
Step: 1 Unlock
Question Has Been Solved by an Expert!
Get step-by-step solutions from verified subject matter experts
Step: 2 Unlock
Step: 3 Unlock
Students Have Also Explored These Related Mathematics Questions!