

Question: solve all the questions Q1. Given information, time series data: Months Sales ($ 000) 1 180 2 170 3 130 120 4 5 110 105
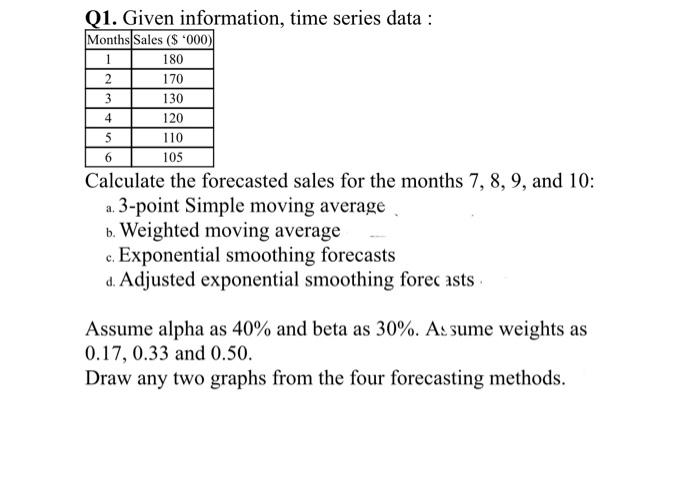
Q1. Given information, time series data: Months Sales ($ 000) 1 180 2 170 3 130 120 4 5 110 105 6 Calculate the forecasted sales for the months 7, 8, 9, and 10: a. 3-point Simple moving average b. Weighted moving average c. Exponential smoothing forecasts d. Adjusted exponential smoothing forecasts Assume alpha as 40% and beta as 30%. Assume weights as 0.17, 0.33 and 0.50. Draw any two graphs from the four forecasting methods. Q1. Given information, time series data: Months Sales ($ 000) 1 180 2 170 3 130 120 4 5 110 105 6 Calculate the forecasted sales for the months 7, 8, 9, and 10: a. 3-point Simple moving average b. Weighted moving average c. Exponential smoothing forecasts d. Adjusted exponential smoothing forecasts Assume alpha as 40% and beta as 30%. Assume weights as 0.17, 0.33 and 0.50. Draw any two graphs from the four forecasting methods
Step by Step Solution
There are 3 Steps involved in it

Get step-by-step solutions from verified subject matter experts