

Question: solve an engineering problem using routine central tendancy, dispersion and Task 1 distribution operations. (P6) Task 1.4 The following values of hire were measured from
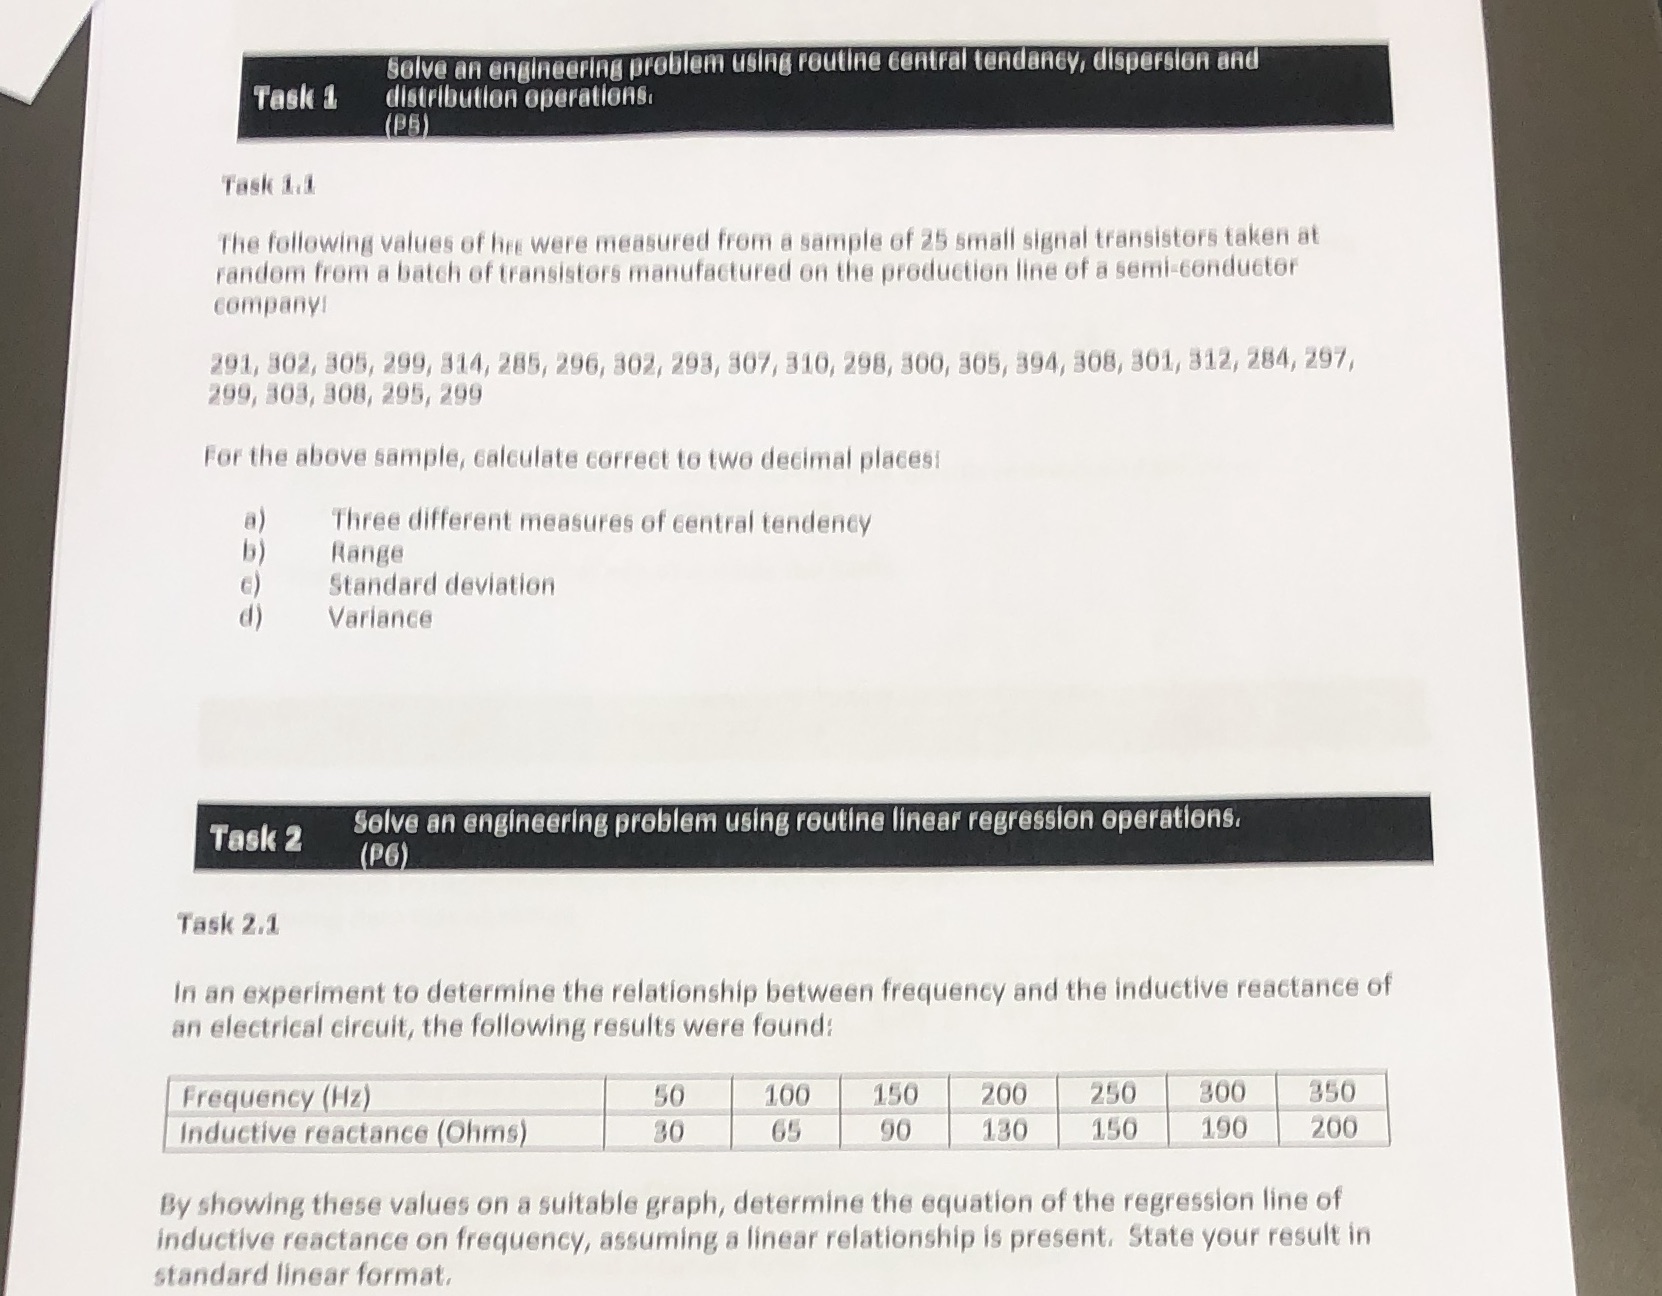
solve an engineering problem using routine central tendancy, dispersion and Task 1 distribution operations. (P6) Task 1.4 The following values of hire were measured from a sample of 25 small signal transistors taken at random from a batch of transistors manufactured on the production line of a semi conductor company! 291, 302, 305, 299, 814, 285, 296, 302, 298, 807, 310, 298, 300, 805, 394, 308, 301, 312, 284, 297, 299, 303, 308, 295, 299 For the above sample, calculate correct to two decimal placesi Three different measures of central tendency Range Standard deviation Variance Task 2 Solve an engineering problem using routine linear regression operations, (PG) Task 2.1 In an experiment to determine the relationship between frequency and the inductive reactance of an electrical circuit, the following results were found: Frequency (Hz) 50 100 150 200 250 300 350 Inductive reactance (Ohms) 30 65 90 130 150 190 200 By showing these values on a suitable graph, determine the equation of the regression line of inductive reactance on frequency, assuming a linear relationship is present. State your result in standard linear format
Step by Step Solution
There are 3 Steps involved in it

Get step-by-step solutions from verified subject matter experts