

Question: solve and explain steps to run the simulation in excel We consider the Butler Internet Company, which distributes a wireless router. Each router costs Butler
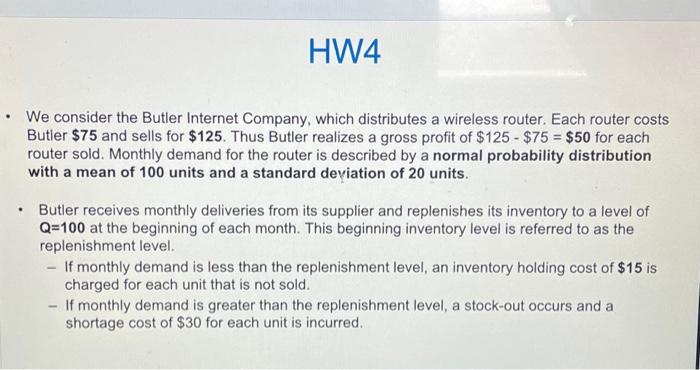
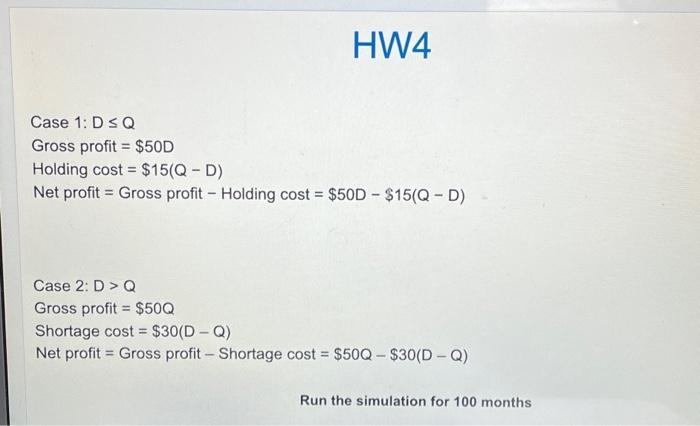
We consider the Butler Internet Company, which distributes a wireless router. Each router costs Butler $75 and sells for $125. Thus Butler realizes a gross profit of $125$75=$50 for each router sold. Monthly demand for the router is described by a normal probability distribution with a mean of 100 units and a standard deviation of 20 units. - Butler receives monthly deliveries from its supplier and replenishes its inventory to a level of Q=100 at the beginning of each month. This beginning inventory level is referred to as the replenishment level. - If monthly demand is less than the replenishment level, an inventory holding cost of $15 is charged for each unit that is not sold. - If monthly demand is greater than the replenishment level, a stock-out occurs and a shortage cost of $30 for each unit is incurred. HW4 Case 1: DQ Gross profit =$50D Holding cost =$15(QD) Net profit = Gross profit - Holding cost =$50D$15(QD) Case 2: D>Q Gross profit =$50Q Shortage cost =$30(DQ) Net profit = Gross profit - Shortage cost =$50Q$30(DQ) Run the simulation for 100 months
Step by Step Solution
There are 3 Steps involved in it

Get step-by-step solutions from verified subject matter experts